 Login
Login Sign Up
What it is?
1. PURPOSE
As the markets are changing so it is wise to use that indicator which adapts quickly the market behaviour as then change. In search of this we have created this indicator.
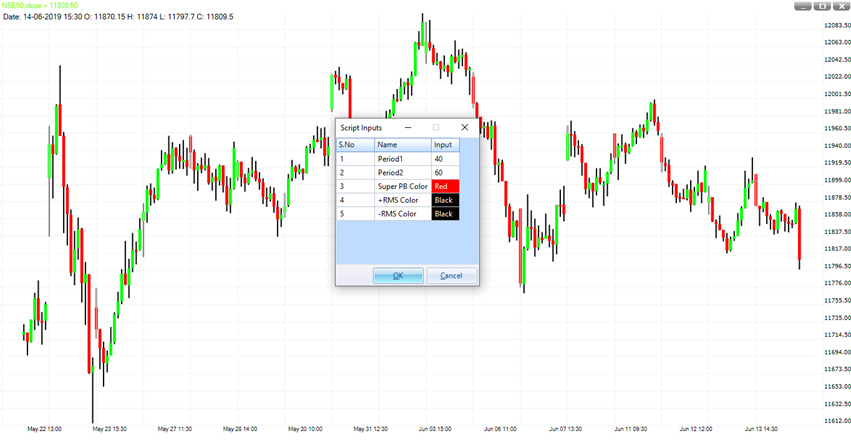
2. INPUTS
This indicator uses following inputs:
Period1 : Default value is 40. We can fiddle this value from 55 up to 95.
Period2 : Default value is 40. We can fiddle this value from 5 up to 45.
These two values are used for the volatility measurement. If difference between these two values is high then we may look for volatility in longer period.
If difference between these two values is lower then we may look for volatility in shorter period.
Rest inputs are used for color only.
We recommend using default value only.
3. HOW TO INTERPRET
S2-Superband is an advance oscillator with an adaptive level of overbought and oversold zone.
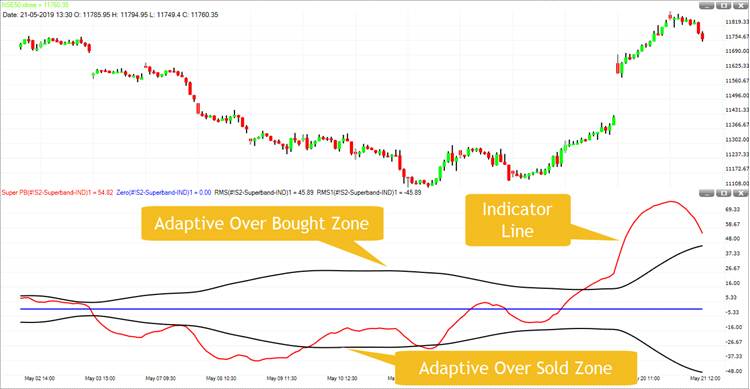
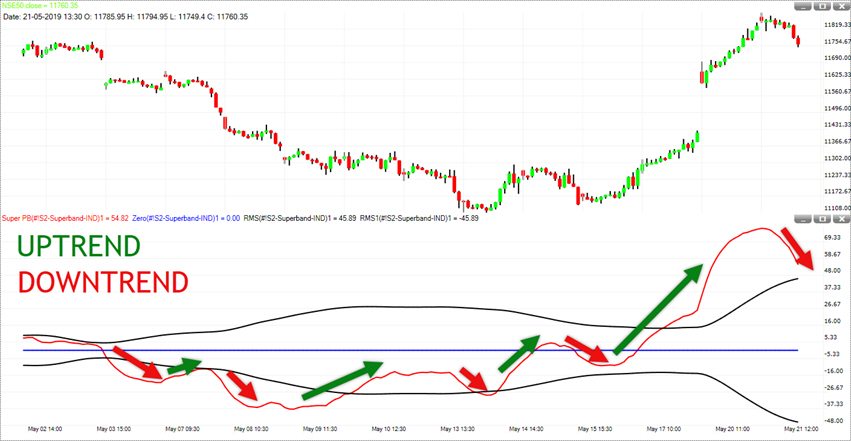
An uptrend can be identified when Oscillator Line (Red Line) is moving up.
A down trend can be identified when Oscillator Line (Red Line) is moving down.
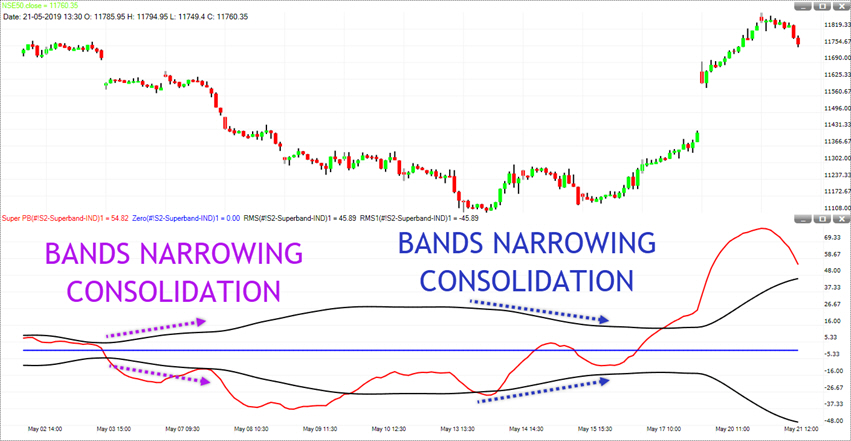
A consolidation can be identified when both Bands start narrowing and move towards each other.
An expansion can be identified when narrow Bands start expanding and move opposite to each other.
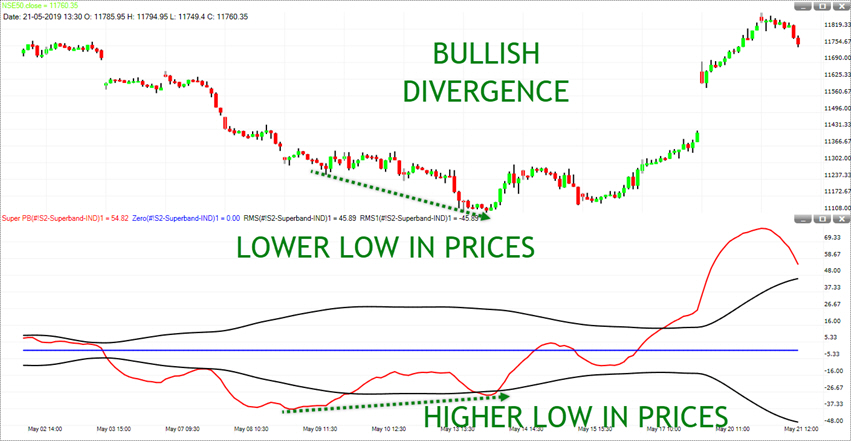
Divergence gives an early warning for trend reversal. A lower low made by prices if not confirm by indicator then it is a sign of ending the down trend and beginning of a range or up trend.
A higher high made by prices if not confirm by indicator then it is a sign of ending the uptrend and beginning of a range or down trend.
Besides indicator, we also have Query, Paint Bar and Strategy by using this indicator.
Let’s discuss these three one by one.
S2-Momentum: Query
We have following conditions for this indicator. Based on these you can scan or create a watch list.
These conditions are;
- Cross below UBand: Indicator line is above upper band, moved lower and crossed below upper band.
- Cross above LBand: Indicator line is below lower band, moved higher and crossed above lower band.
- Falling-above zero: Indicator line is above zero (mid) line but direction is down.
- Rising-below zero: Indicator line is below zero (mid) line but direction is up.
- Rising-ALL: All the three (Indicator & Bands) lines are moving up.
- Falling-ALL: All the three (Indicator & Bands) lines are moving down.
- Bands Closing: Bands are narrowing (moving towards each other)
- Bands Opening: Bands are expanding (moving against each other)
- Below LBand: Indicator line is below lower band. Direction can be either side.
- Above UBand: Indicator line is above upper band. Direction can be either side.
- Change to UP: Indicator line direction is down and then turns up in current bar.
- Change to DN: Indicator line direction is up and then turns down in current bar.
Steps to scan
First you need to open a chart and then insert this query from the MENU SCRIPT.
At the lower end of SCRIPT List Window you will find a tab named SCAN. Just click on that.
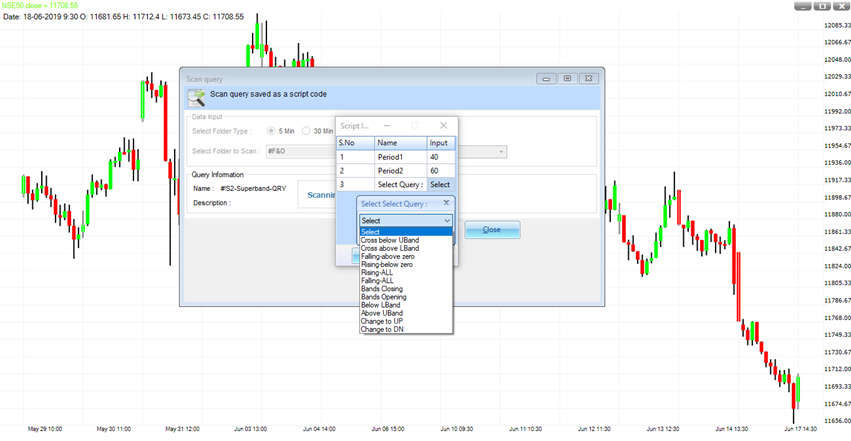
Once you click the scan tab a new window will appear in front of you. You need to fill the details here.
- Select Folder Type: Under this you need to choose the timeframe.
- Select Folder to scan: Choose the folder from the list where you want to scan the query.
- Select compression: We need to select the data compression here.
Click on SCAN tab shown in the bottom of the window.
Once you click on the SCAN a new widow will appear in front of you.
Select whichever condition you want to scan and then click on OK.
You will get a list of stocks where prices have met with selected condition.
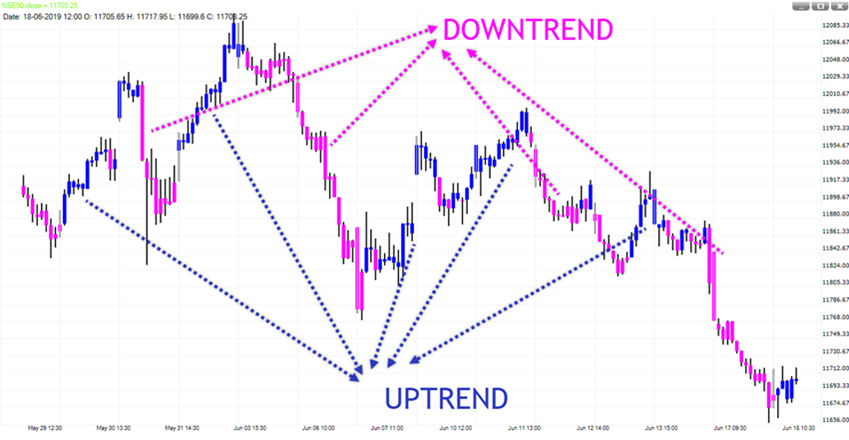
S2-Momentum: Paint Bar
This paint bar helps you to identify the trend.
You can choose color for uptrend and downtrend from the input
For example, we have chosen Blue color for uptrend and Magenta color for downtrend.
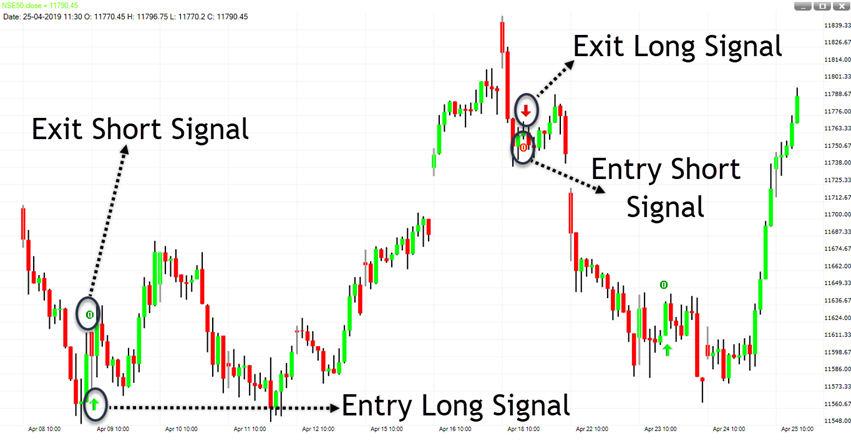
S2-Momentum: Strategy
It is a continuous system. It means you will always have a position in market either long or short.
- A green arrow (below the price bar) means a long position is taken here.
- Red colour ZERO (0) below the price bar means the long position have closed here.
- A red arrow (above the price bar) means a short position is taken here.
- Green colour ZERO (0) above the price bar means the short position have closed here.
You can use this strategy by two ways:
- Follow it blindly. Means wait for a signal and then take positions accordingly.
- Take position on the entry. Take partial exit whenever a desired profit/loss met and then carry the remaining position as per the system.
4 thoughts on “S2 Superband”