Login
Login Sign Up
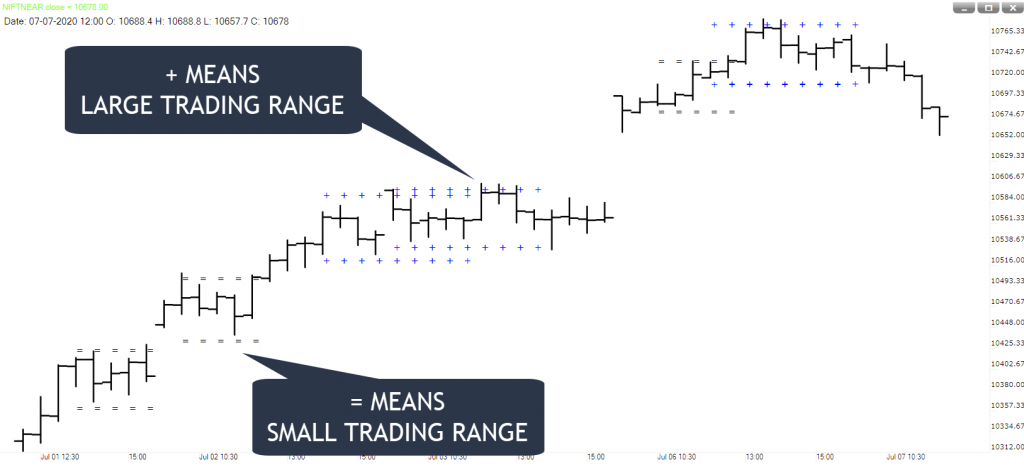
Identify Trading Ranges on the chart
How to download
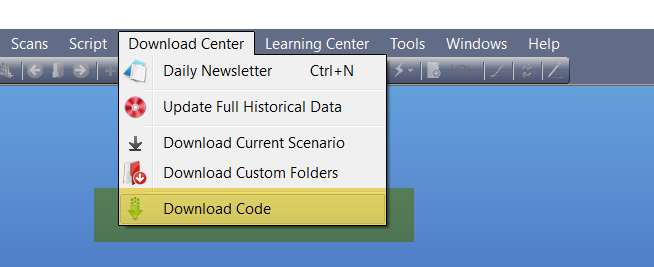
Open Trend Analyser and then click on the Menu – Download Center.
Please select option Download codes.
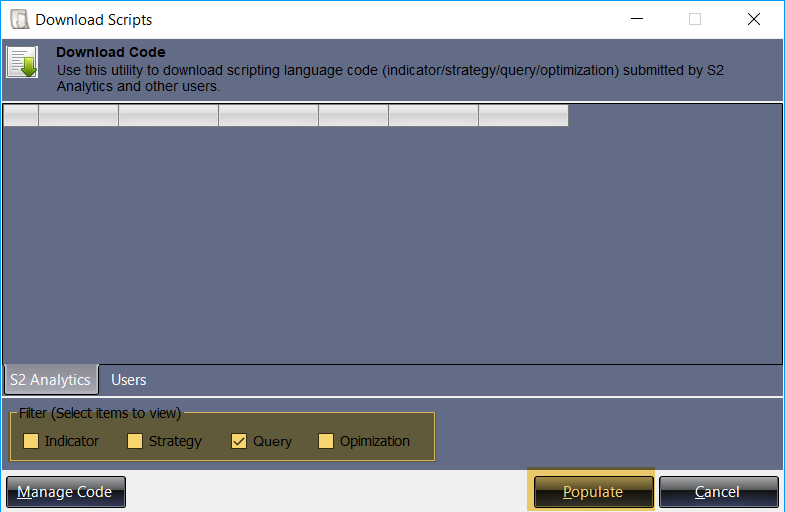
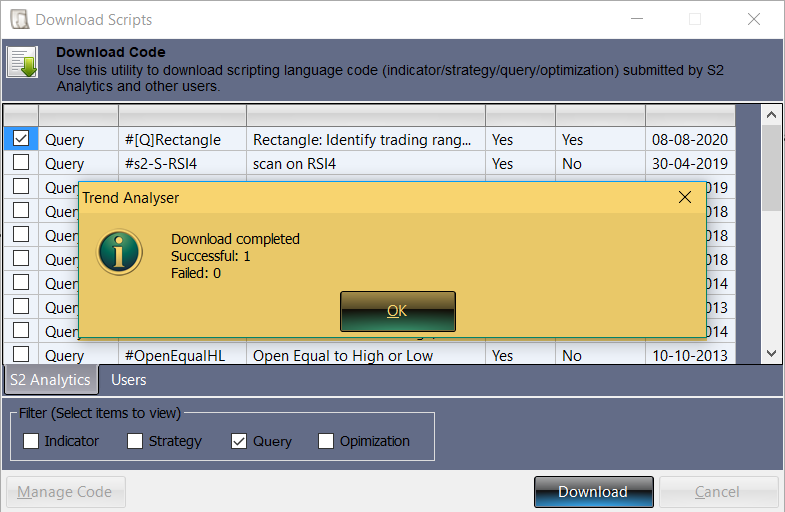
A window of Download Scripts will appear in front of you. On the lower panel in this window Mark the indicator box and then click on Populate Tab.
A new window will appear on your screen with the list of available indicators to download. Mark on #[Q]Rectangle and then click on download.
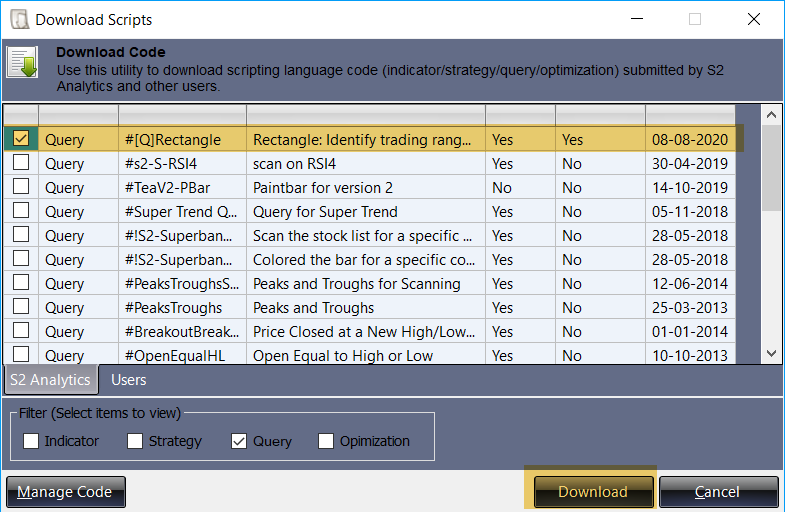
You will get a message of Download Complete. Click on OK to complete the process.
How to apply this indicator on chart?
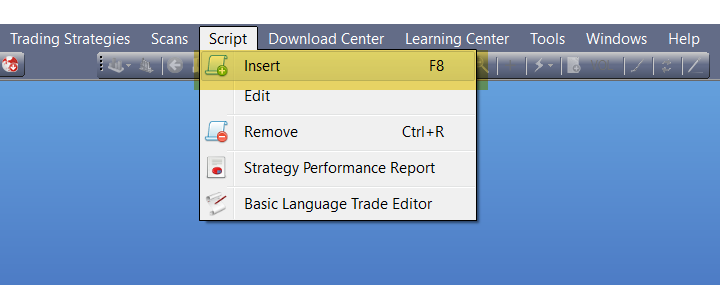
In order to apply this indicator you need to open a chart first and then click on the Menu – Script and then select option ‘Insert.’
A new window will appear on your screen with the list of available scripts to apply. Select #[Q]Rectangle and then click on OK.
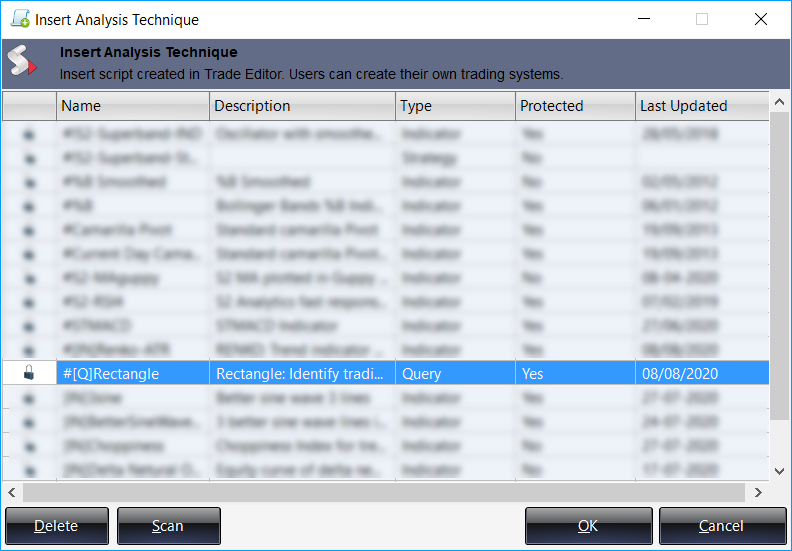
If you want to know the list of stock from a folder where these rectangles are visible then click on SCAN.
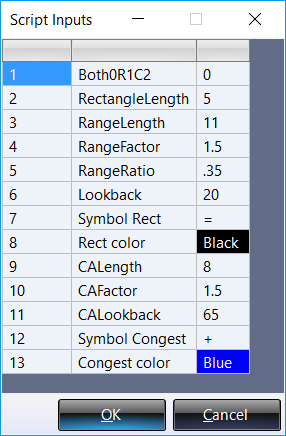
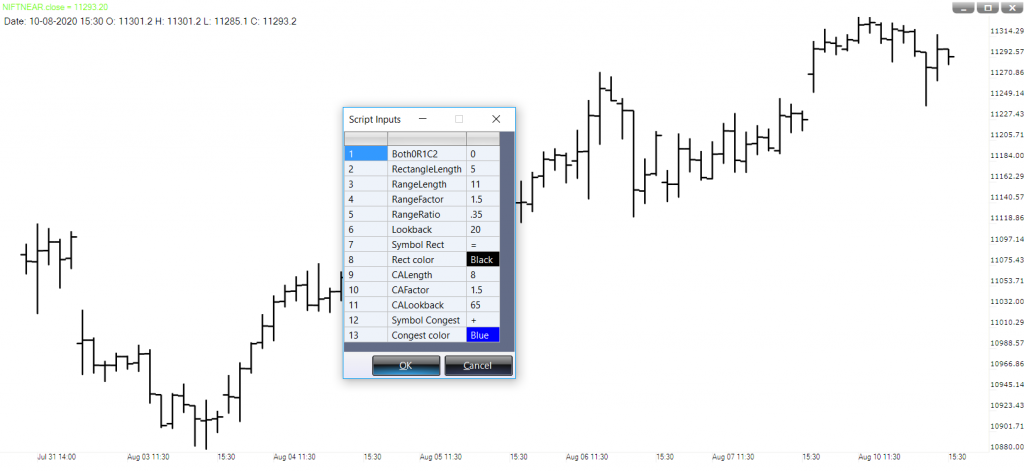
A window of Script Input will appear on your screen. You can use the default inputs or change it then click on OK.
How to use this Indicator?
PURPOSE
All market theories have one thing in common. We call it cycle of Expansion and Contraction. The cycles are not perfect, in the sense that we cannot always say when contraction ends and expansion begins. However imperfect are these cycles but they exist in the stock markets.
We have developed two indicators within one. These two indicators are capable to identify trading ranges as they develop.
One indicator used for intraday traders while another is for carry forward traders. You can also use both indicators for both the purposes.
INPUTS
We recommend traders to use the default inputs only. This indicator uses following inputs:
Both0R1C2: Default input is ‘0’ means both ranges will be visible on chart. Use ‘1’ if you want to use small trading range and use ‘2’ if you want to use large trading range.
Following inputs are used for small trading range:
RectangleLength: Default input is ‘5’. It means it will identify a trading range for 5 bars.
RangeLength: Default input is ‘11’. Lower value means less trading ranges and higher value means more trading range on the chart.
RangeFactor: Default input is ‘1.5’. Lower value means tight range while higher value means wide range.
RangeRatio: Default input is ‘0.35’. Lower value means less trading ranges and higher value means more trading range on the chart.
Lookback: Default input is ‘20’. It means it will consider the last 20 bars price action to calculate the trading range.
Symbol Rect: Default input is ‘=’. The symbol shows the boundaries of a trading range.
Rect color: Default input is ‘Black’. This will help you to choose the Rectangle color.
Following inputs are used for large trading range:
CALength: Default input is ‘8’. It means it will identify a trading range for 8 bars.
CAFactor: Default input is ‘1.5’. Lower value means tight range while higher value means wide range.
CALookback: Default input is ‘65’. It means it will consider the last 20 bars price action to calculate the trading range.
Symbol Congest: Default input is ‘+’. The symbol shows the boundaries of a trading range.
Congest color: Default input is ‘Blue’. This will help you to choose the Rectangle color.
HOW TO INTERPRET
Contraction
Markets go through periods of contraction when prices move in a narrow range while trader interest comes down. When markets are doing nothing, they are giving a message: the periods of contraction see a balance between bulls and bears. Neither one is strong enough to take the market in their direction.
Expansion
Soon enough, one of the two forces – either the bulls or the bears will emerge as the stronger force. Then comes a period of expansion, when the winning force will take the market sharply in its favour, trapping the losing force. This is the period when markets will move with large ranges, in any one direction.
We should always look for contraction. The reason is big profits always come in Expansion phase. Congestion Zone or Trading Ranges on the chart are the Contraction.
Long Trade
Buy above the upper line.
You stop will be lower line.
IF markets are trending then place a target twice the range width.
IF markets are non-trending then place a target same the range width.
Short Trade
Short below the lower line.
You stop will be upper line.
IF markets are trending then place a target twice the range width.
IF markets are non-trending then place a target same the range width.