 Login
Login Sign Up
PURPOSE
Moving Averages (MA) is a trend following indicator. However we can also use it as a momentum oscillator by calculating the difference of two MA’s.
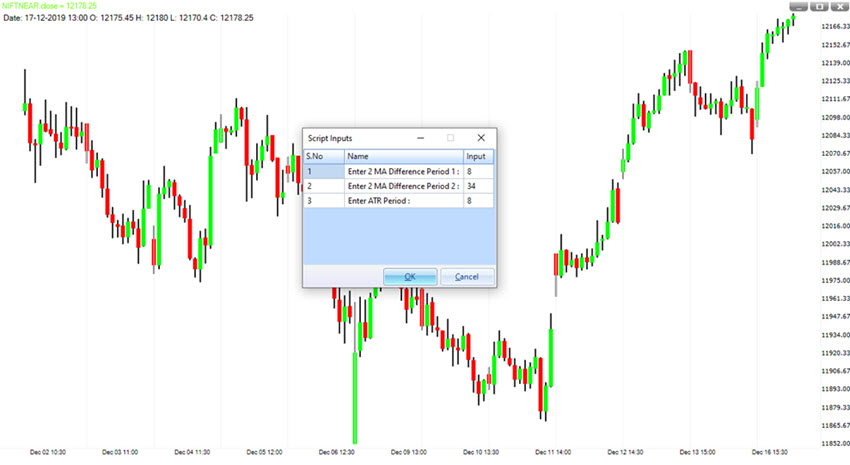
INPUT
This strategy uses two MA. First one is a shorter period and second one is longer period. The strategy does not allow you to change the MA Type. However you can change the MA period. We have also given a n ATR value which is used for setting a Stop and Target level.
HOW TO INTERPRET
There are many ways to use MA for trading. MA Difference is one of them. Idea here is to identify a swing low or high within an ongoing trend and then try to capture a portion of that swing.
First the strategy establishes a trend by using the long period MA. After that the strategy tries to identify a swing high (in a downtrend) and swing low (in an uptrend).
Once we enter in a trade (long or short) the strategy then gives us a stop and target level by using the ATR indicator.
We use ATR based stops due to the dynamic nature of the market. The strategy uses a 1:2 risk reward ratio so that if the number of losing trades is higher it will not impact much of our net profit. Stops are trailing in nature.
OUTPUT
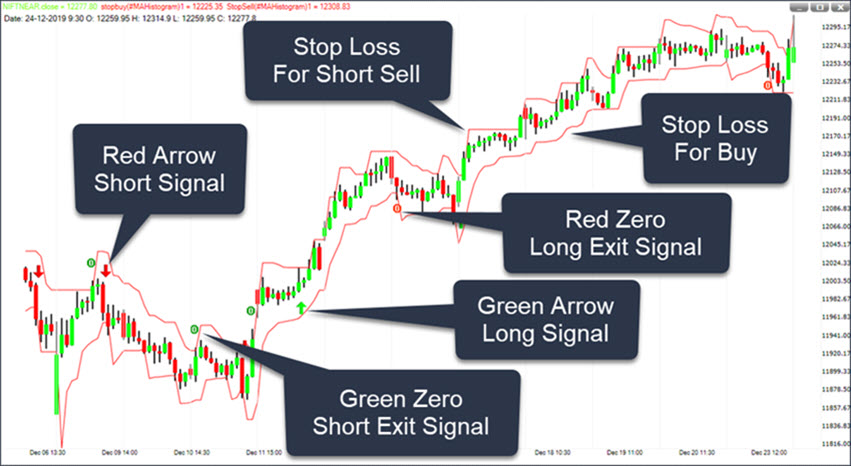
A green arrow (below the price bar) means a long position is taken here.
Red colour ZERO (0) below the price bar means the long position has closed here.
A red arrow (above the price bar) means a short position is taken here.
Green colour ZERO (0) above the price bar means the short position has closed here.
1 thought on “MA Histogram”