Login
Login Sign Up
Identify trend based on Classical Renko Chart
How to download
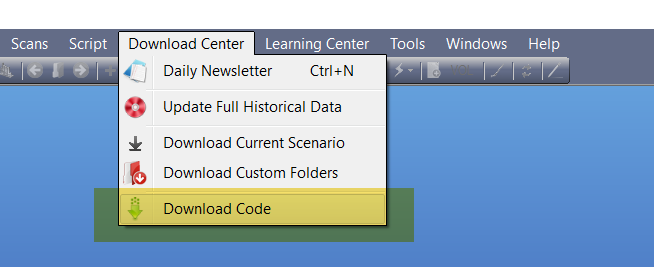
Open Trend Analyser and then click on the Menu – Download Center.
Please select option Download codes.
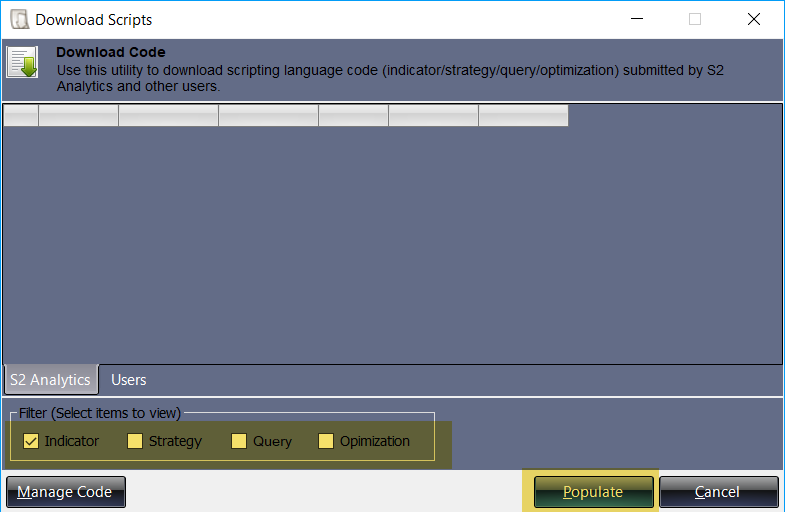
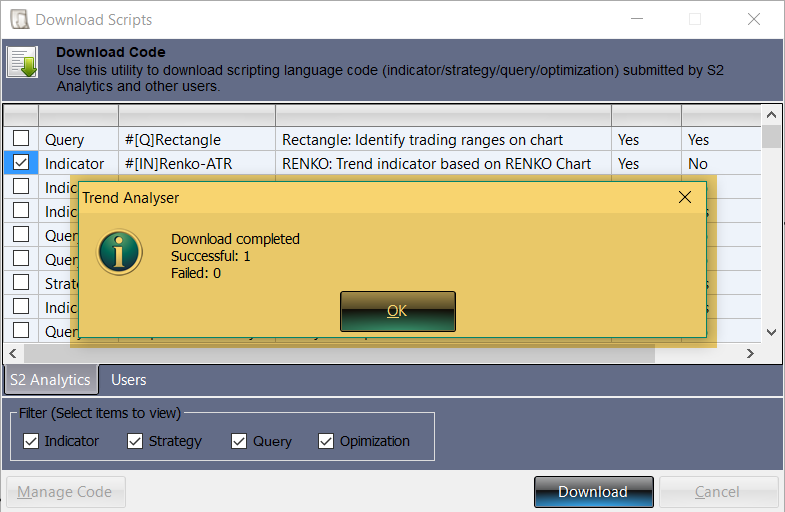
A window of Download Scripts will appear in front of you. On the lower panel in this window Mark the indicator box and then click on Populate Tab.
A new window will appear on your screen with the list of available indicators to download. Mark on #[IN]Renko-ATR and then click on download.
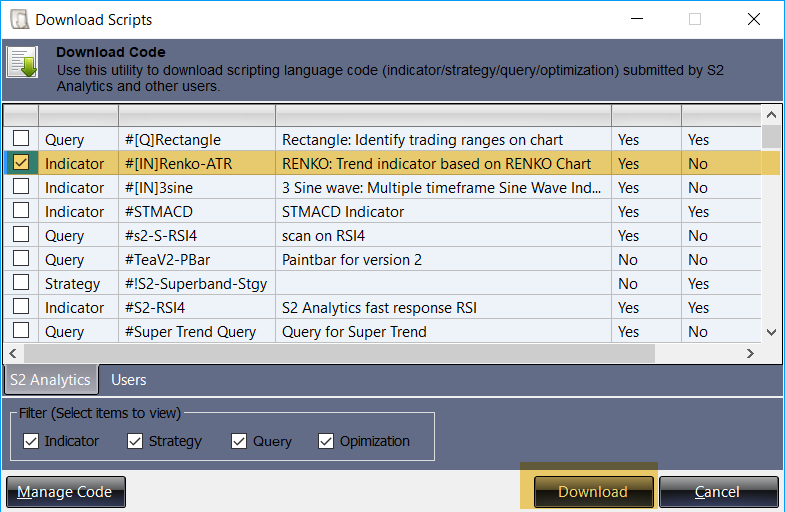
You will get a message of Download Complete. Click on OK to complete the process.
How to apply this indicator on chart?
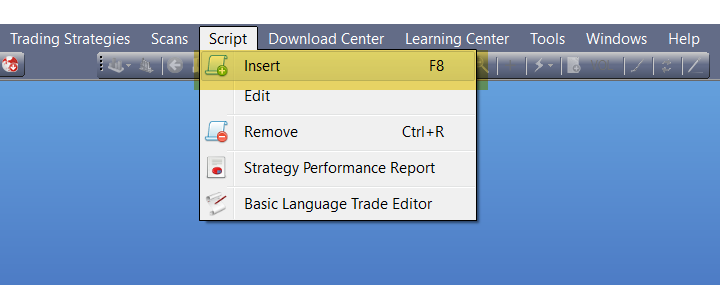
In order to apply this indicator you need to open a chart first and then click on the Menu – Script and then select option ‘Insert.’
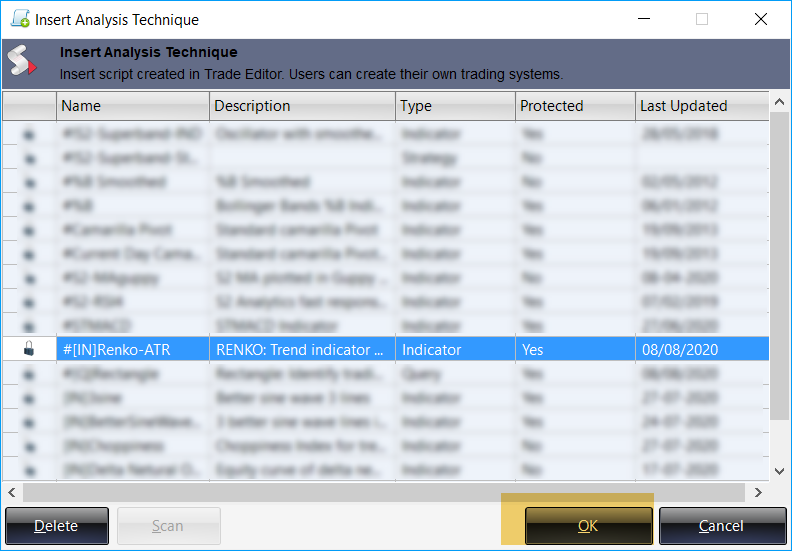
A new window will appear on your screen with the list of available scripts to apply. Select #[IN]Renko-ATR and then click on OK.
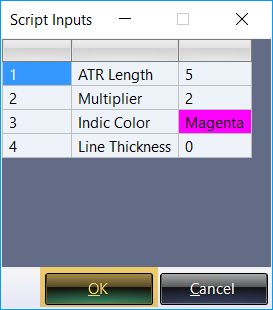
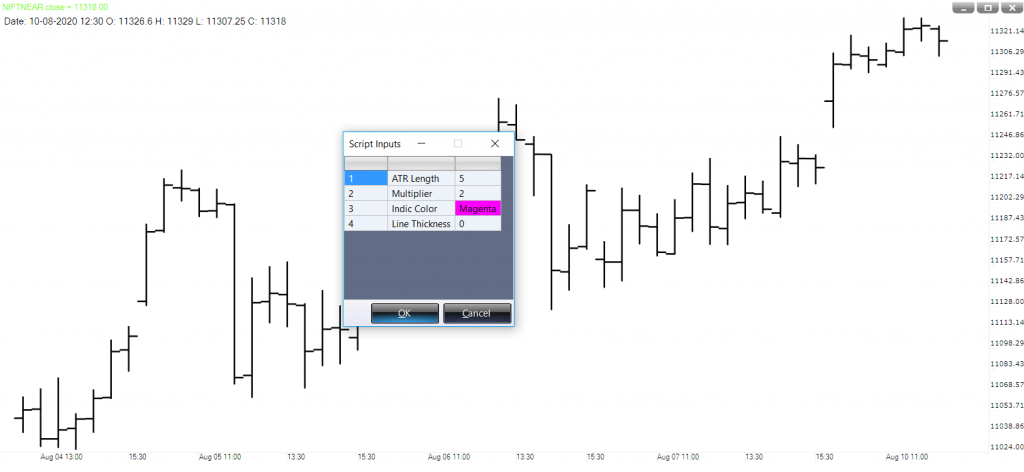
A window of Script Input will appear on your screen. You can use the default inputs or change it then click on OK.
How to use this Indicator?
PURPOSE
Renko charts are a way to view price movements of an asset that filters out minor price movements. Because those small fluctuations are removed, price trends may be easier to spot, and that feature makes Renko charts the preferred price chart for some traders.
We have created an indicator on the same basis as Renko chart uses and we can also plot it over any price chart.
INPUTS
We recommend traders to use the default inputs only. This indicator uses following inputs:
ATR Length: Default value is 5. We can fiddle this value on the basis of trade timing. Lower value will consider the recent price action and higher value will consider the higher time.
Multplier: This input helps you to decide the box size or length to calculate the Indicator.
Indic Color: This input helps you to choose the color for the Indicator lines.
Line Thickness: This input helps you to choose the thickness of Indicator lines.
HOW TO INTERPRET
A normal price chart plots the price each time a certain unit of time transpires. In contrast, a Renko chart is only concerned with price, and not time – and it only displays price changes that meet a certain minimum magnitude.
Price changes that don’t clear this hurdle are ignored. This filtering out of smaller price movements keeps the focus on significant moves, and helps you to disregard noise.
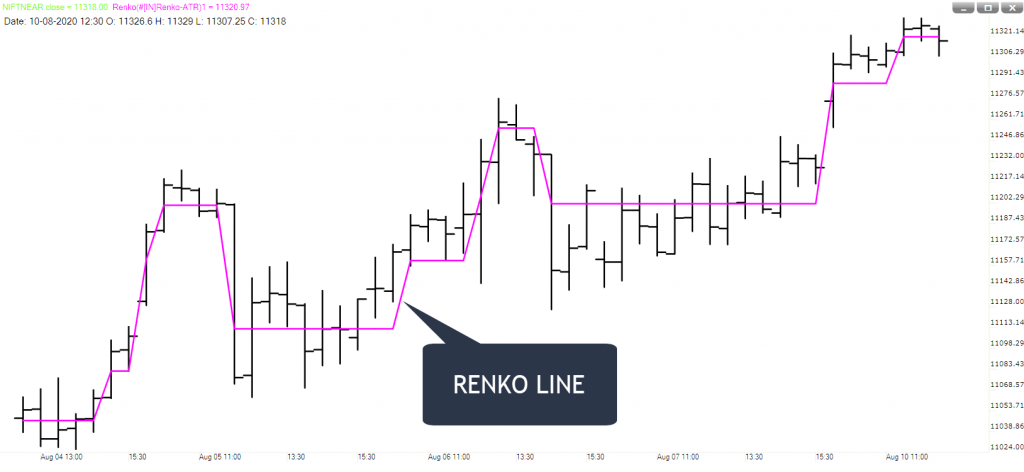
With the help of this indicator, we can easily spot and identify a trend and a pause in a trend.
We have combined the Renko calculation with ATR Indicator. By doing this we can have a clear picture of trend and volatility within a trend based on recent price action.
OUTPUT
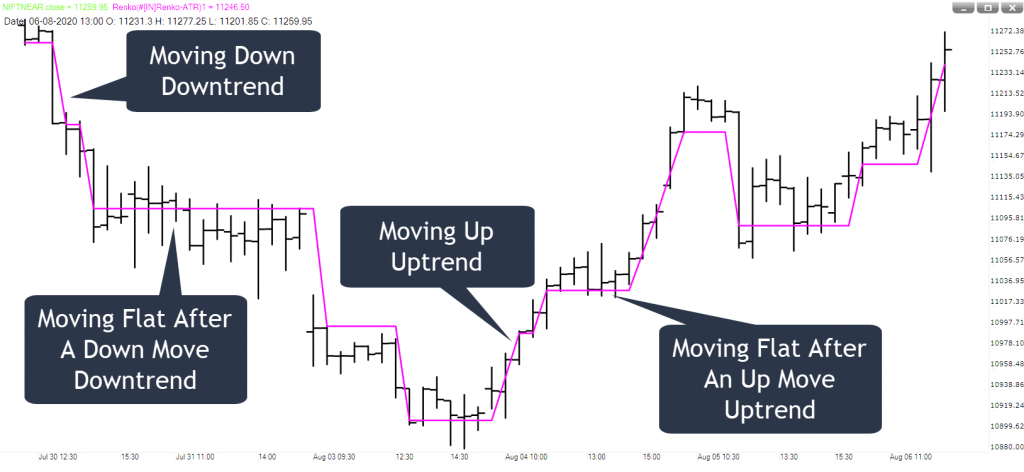
The indicator mainly gives us these four outputs.
Up Trend: If indicator (Magenta) line is moving higher.
Pause in an Up Trend: If indicator (Magenta) line is moving flat after an up move.
Down Trend: If indicator (Magenta) line is moving lower.
Pause in a Down Trend: If indicator (Magenta) line is moving flat after a down move.