Trend Analyser
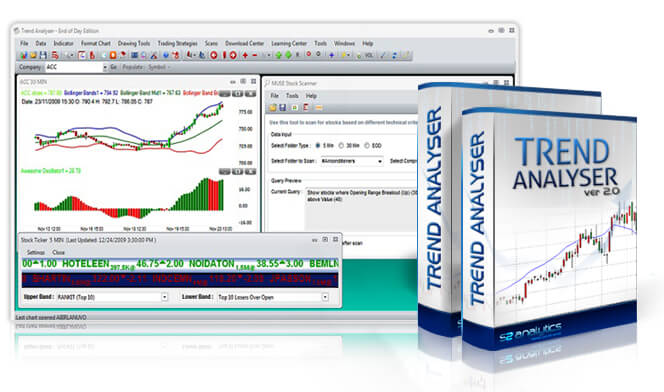
Trend Analyser is a professional charting and analysis software that comes with state-of-the-art tools to determine trend, momentum, buy and sell points for stocks.
Trend Analyser is a professional charting and analysis software that comes with state-of-the-art tools to determine trend, momentum, buy and sell points for stocks.
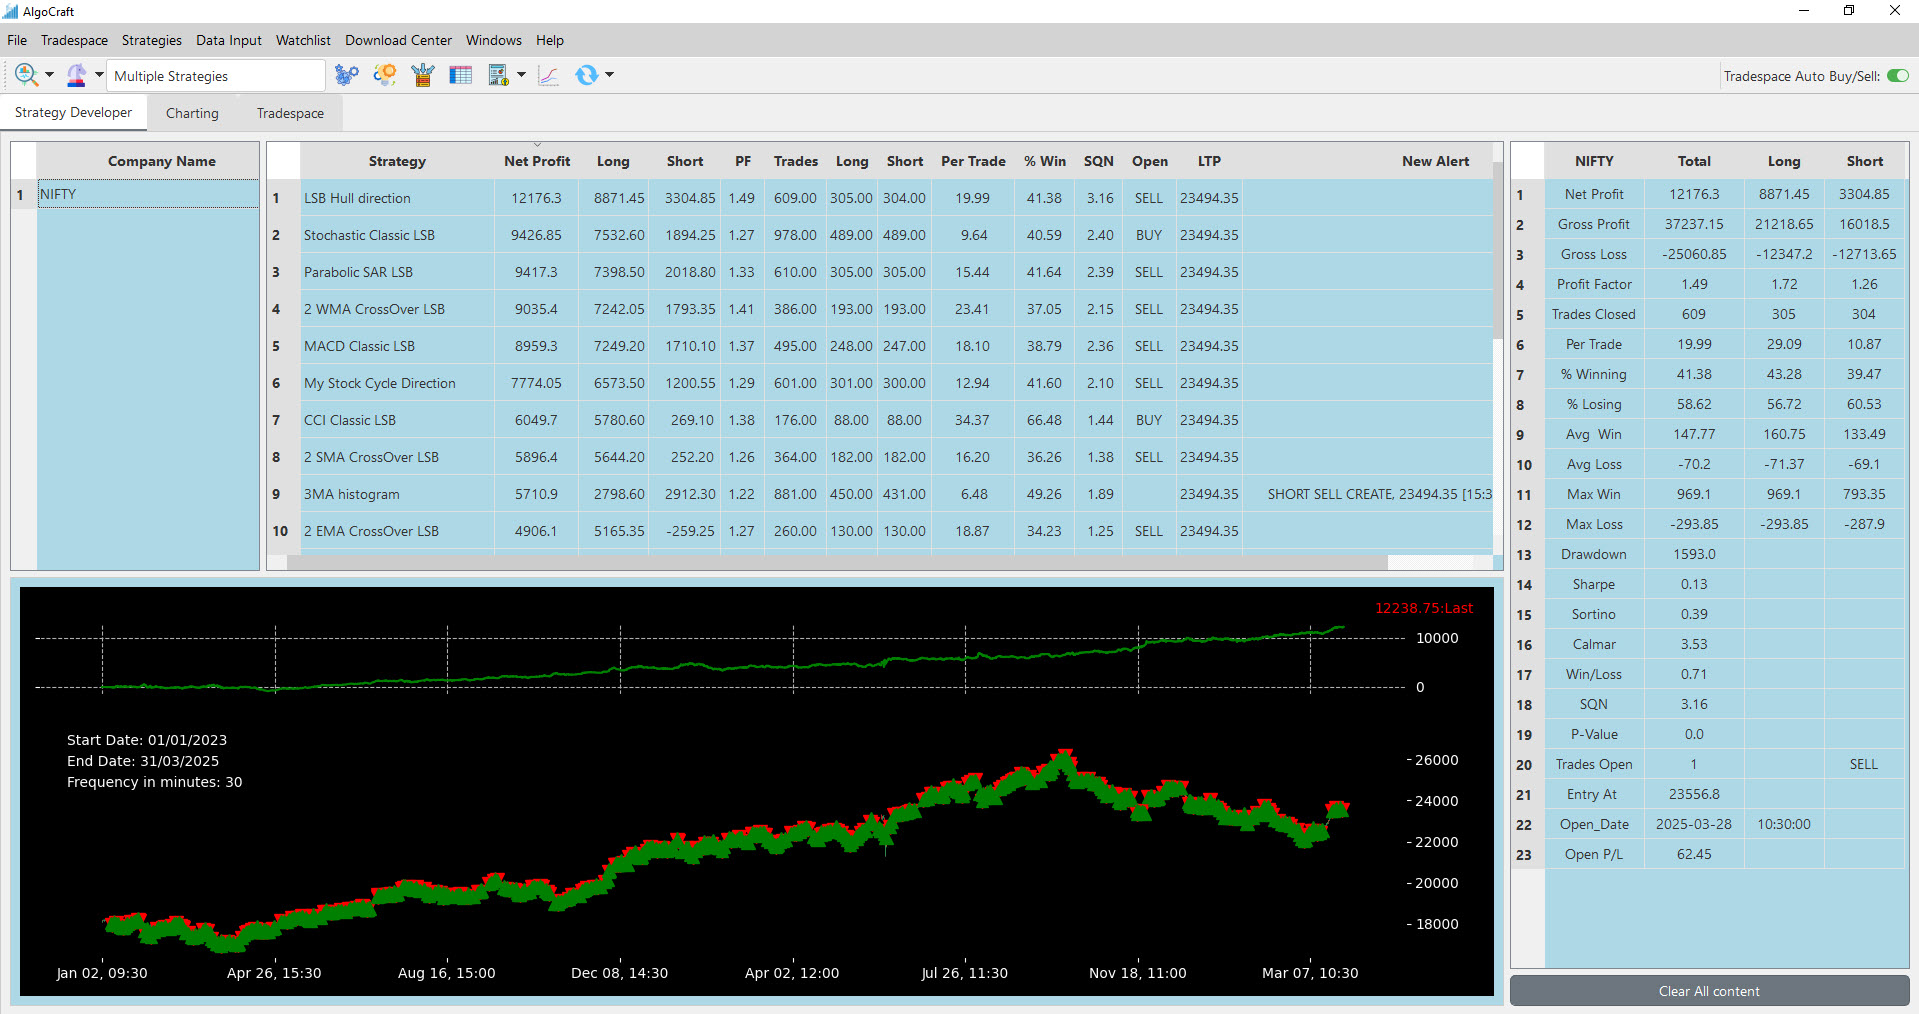
AlgoCraft empowers users to effortlessly scan and algo trade companies using built-in strategies
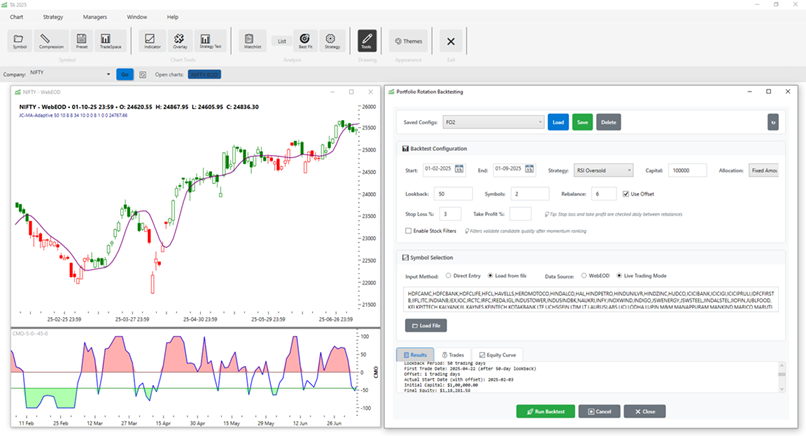
TA2025 is the next generation charting and analysis software. It is full of cutting edge tools such as enhanced charting, portfolio manager, back-testing engine, walk forward optimization and smart ma
Trend Analyser is a professional charting and analysis software that comes with state-of-the-art tools to determine trend, momentum, buy and sell points for stocks.
AlgoCraft empowers users to effortlessly scan and algo trade companies using built-in strategies
TA2025 is the next generation charting and analysis software. It is full of cutting edge tools such as enhanced charting, portfolio manager, back-testing engine, walk forward optimization and smart ma


The strategies available in Trend Analyser are shown below in detail.
You will also find help on special indicators found in TA along with general trading setups.
We have created some advance level of trading strategies, indicators and scanning tools in script editor.
You will find detailed explanations here.
Looking for stock market analysis tools? Check out our best day trading strategy that can help you make profit in the stock market.
What is C9 set up?
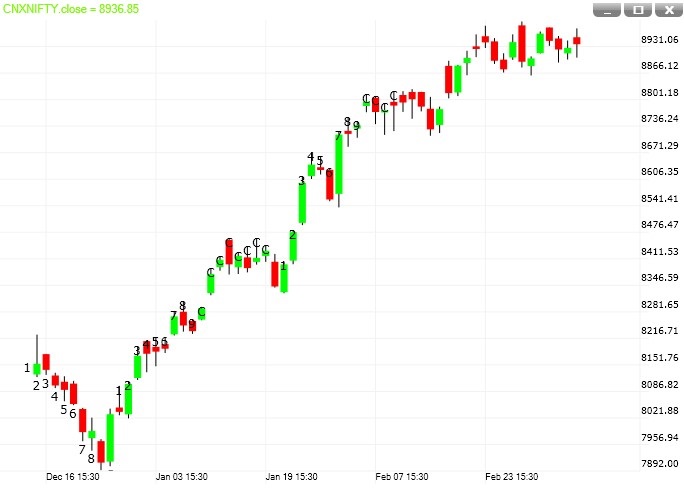
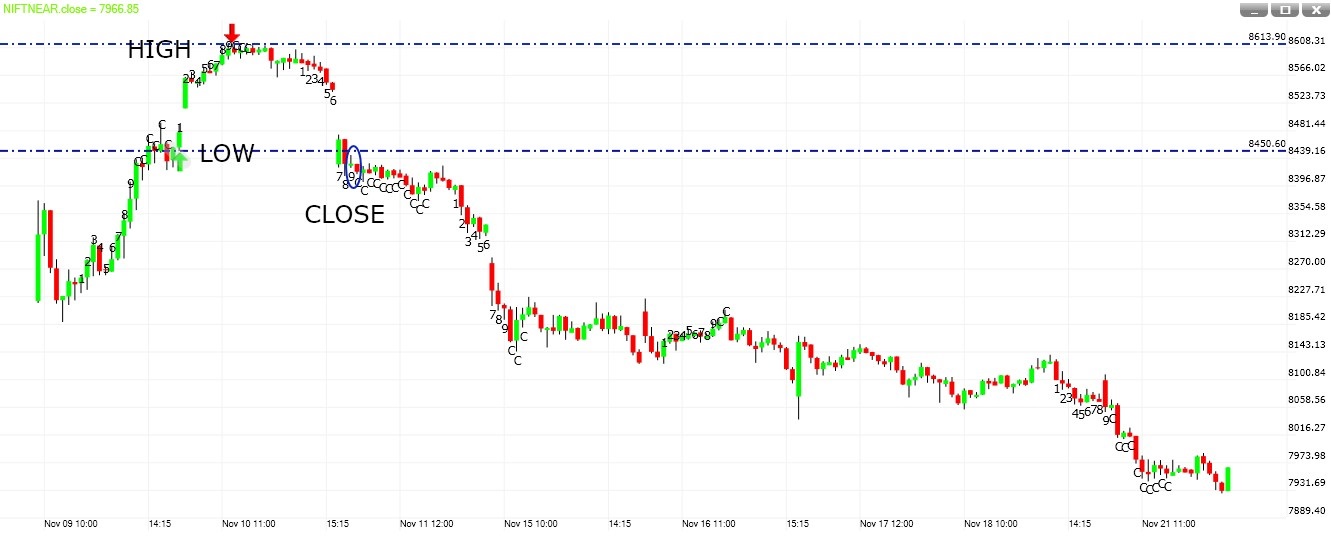
The C9 indicator consists of a set of numbers (from 1 to 9) & the letter 'C'. The numbers & the letter 'C' are displayed on price charts at specific locations.
When a series of C9 numbers from 1 to 9 appear below prices, selling may be getting exhausted. When a series of C9 numbers from 1 to 9 appear above prices, buying may be getting tired.
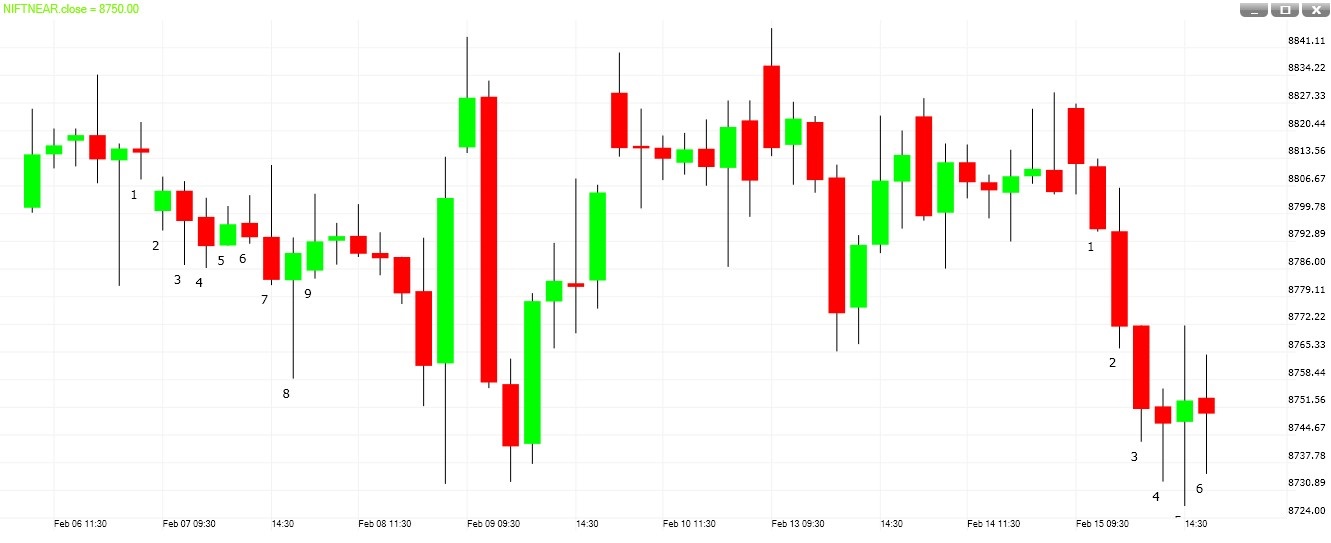
C9 REVERSALS: INCOMPLETE
Warning: C9 reversals which are under way or incomplete can be cancelled and disappear, therefore this option should be used with extreme care.
The setup starts with number 1. As far the conditions meet with the price action, the setup continues to the next number. In between if price action differs from the conditions then the setup abruptly vanishes.
In the chart below (Nifty 60 min timeframe), the C9 Setup (downside) started and reached till number 6.
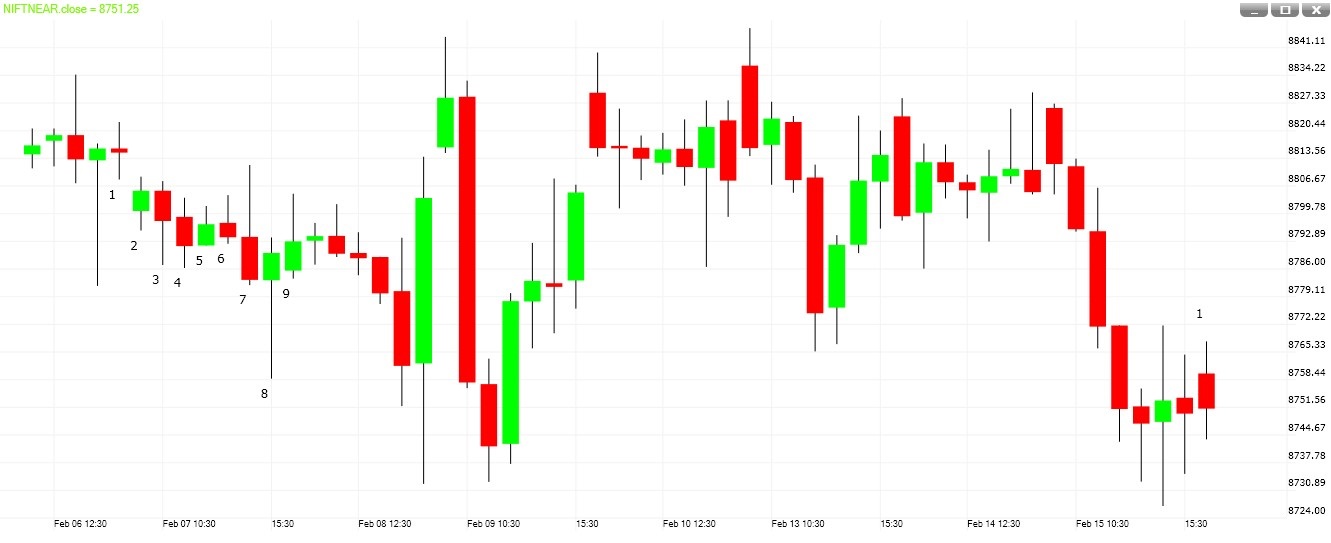
Now data has updated for the next 60 min. In this the prices action differs with the Setup condition. Thus the number vanishes and also a new setup (upside) starts.
Now data has updated for the next 60 min. In this the prices action differs with the Setup condition. Thus the number vanishes and also a new setup (upside) starts.
C9 REVERSALS: SET UP COMPLETION
C9 reversals are assumed to be completed when 1 to 9 numbers appear on the chart. After 9, ‘C’ can continue but the pattern will remain visible, and considered complete.
A complete C9 Setup

C 9 tells the traders:
Finding Top

Finding Bottom

Features:
C9 can differentiate between trending and non-trending price action.
If close of the current C9 9th bar is between the High – Low of the previous completed C9 setup in the opposite direction, then the market is in a trading range.
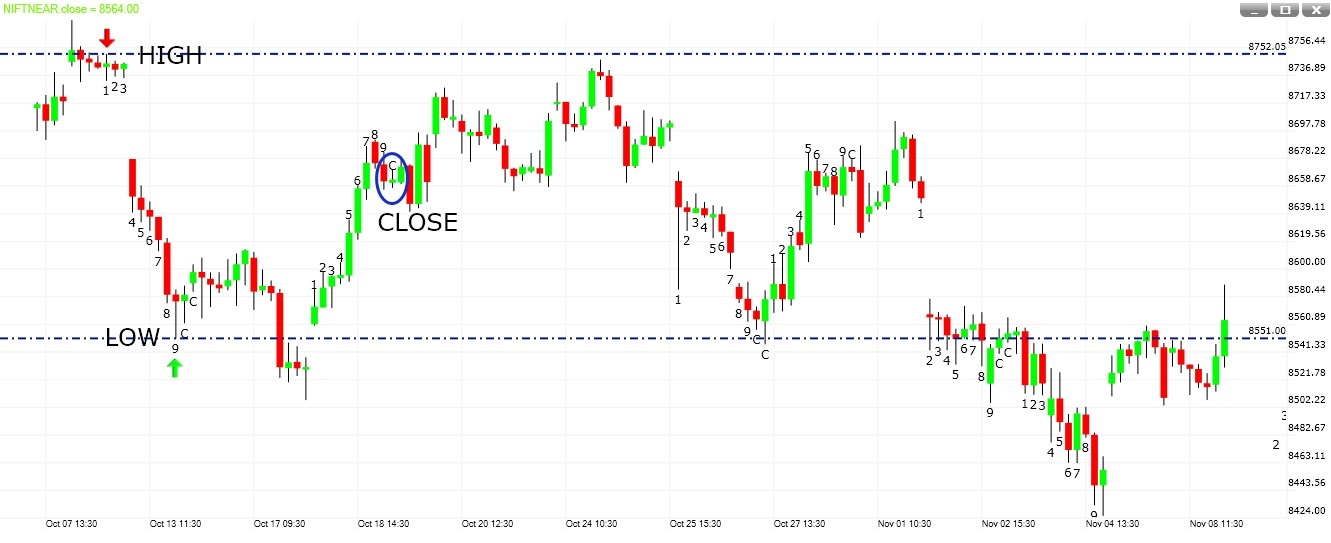
Current C9 – close of the 9th bar is above the High of the previous completed C9 setup in the opposite direction, and then the market is in an uptrend.
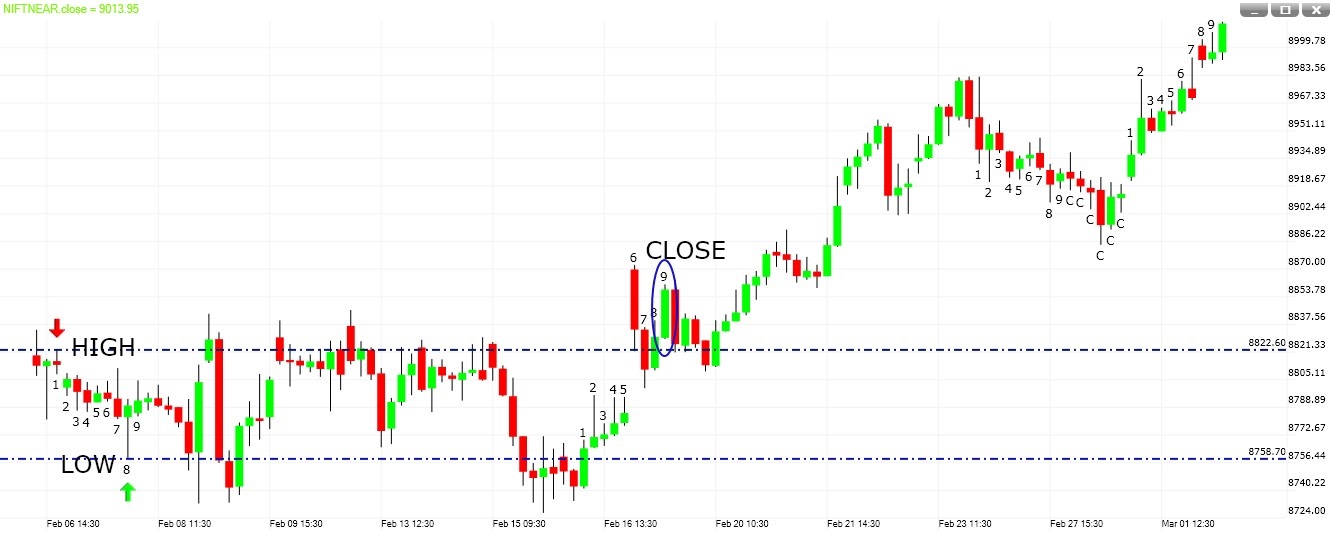
Current C9 – close of the 9th bar is below the Low of the previous completed C9 setup in the opposite direction, and then the market is in a downtrend.
Summary:
When a complete C9 set up is visible then
(a) Close positions, or
(b) Tighten stops
The C9 signal becomes more powerful when there is additional technical evidence.
When C9 gives a reversal signal, the selling of options becomes a viable strategy. After a confirmed C9, prices should reverse, or consolidate. In both cases, options premiums will fall.

A trading strategy based on the Alligator and Fractals concept.
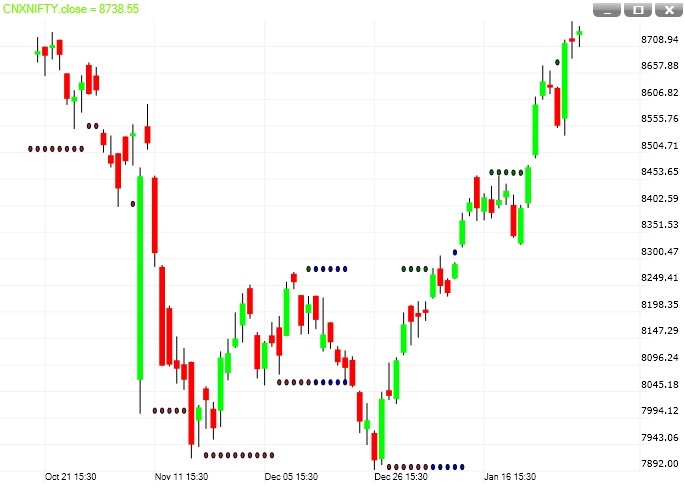
The Chaos indicate signal by 3 Dots (Green, Brown & Blue).
Green Dots signify buy signals. No sell signals in an uptrend. 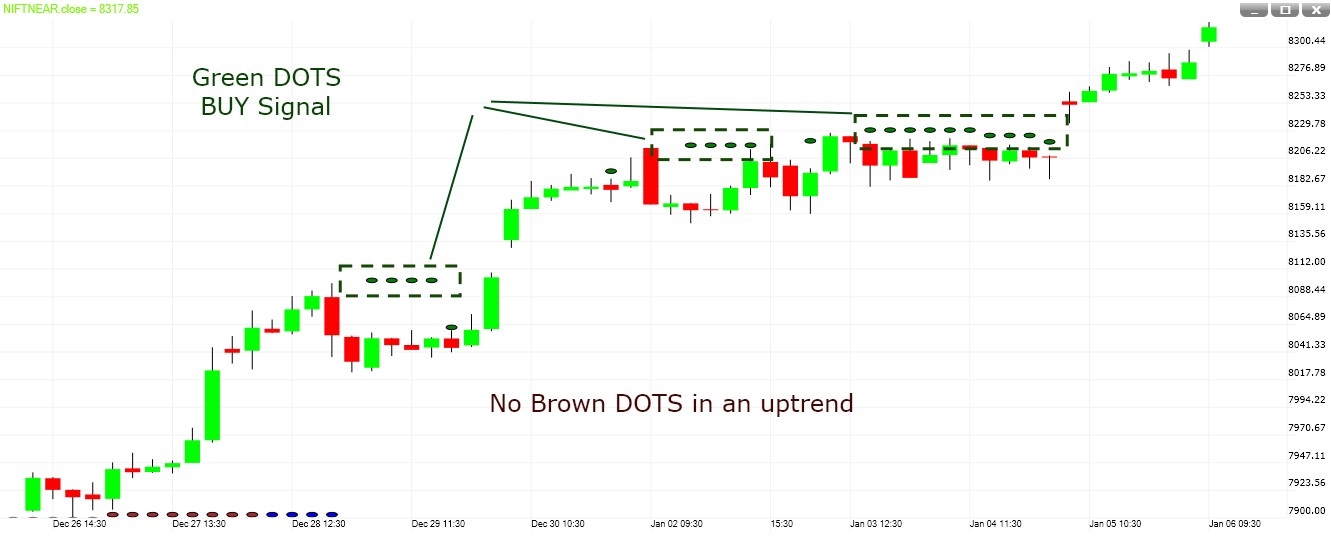
Brown Dots signify sell signals. No buy signals in a downtrend.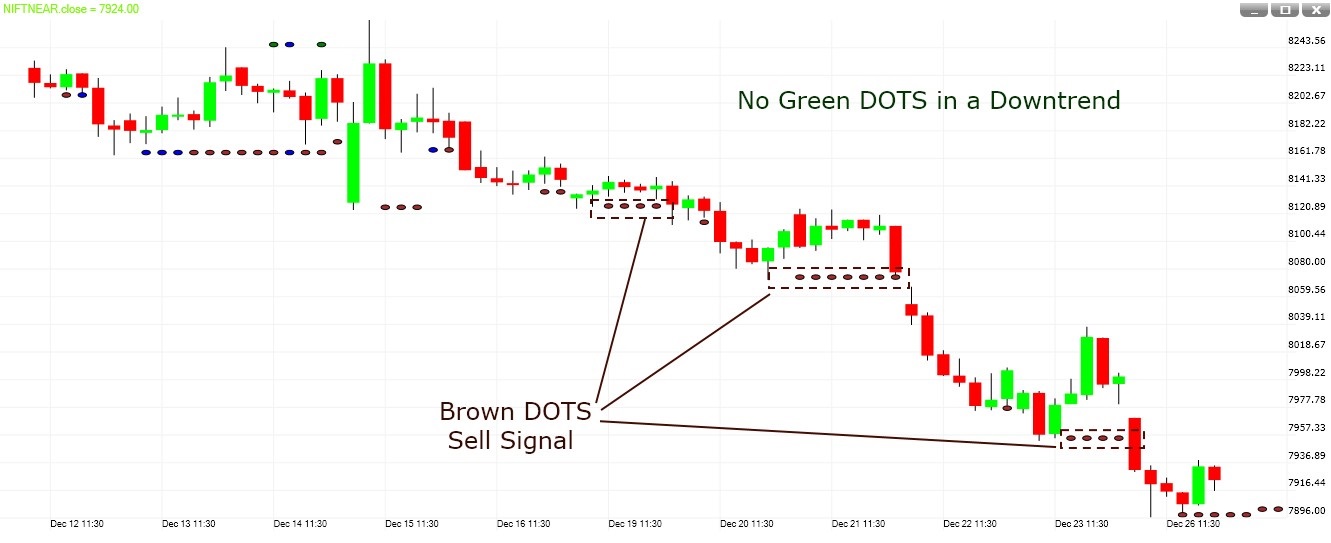
Blue Dots signify a 'Non-Trending / Sideways' market.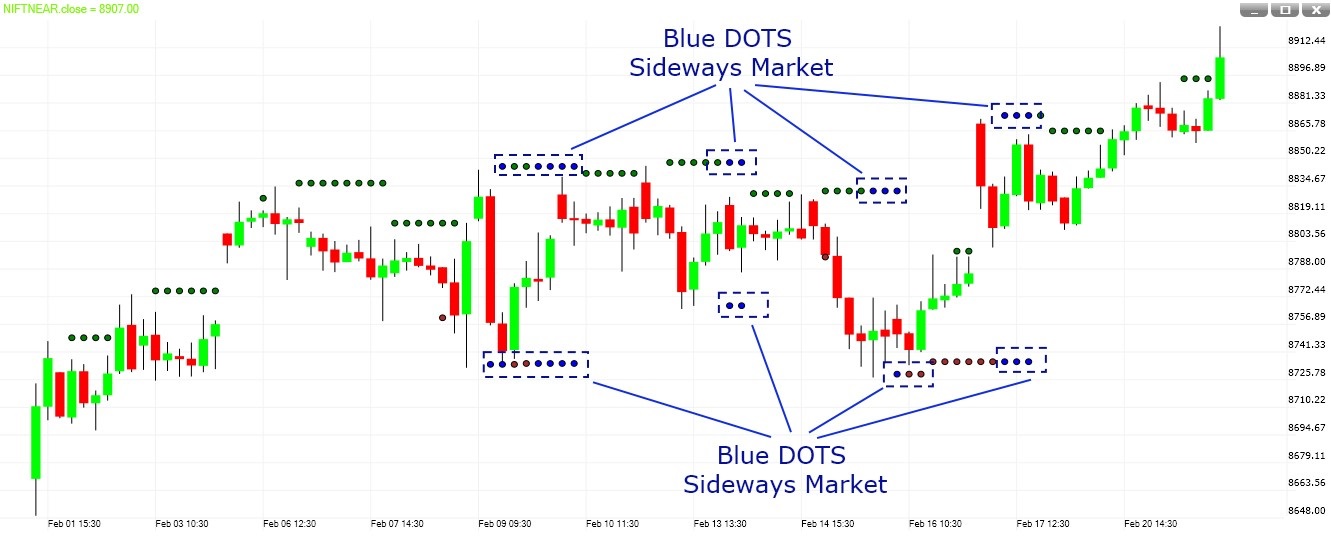
Dot's which appear above price highs are buy levels.
Dot's which appear below price lows are sell levels.
When the market is sideways we can take both buy & sell signals.
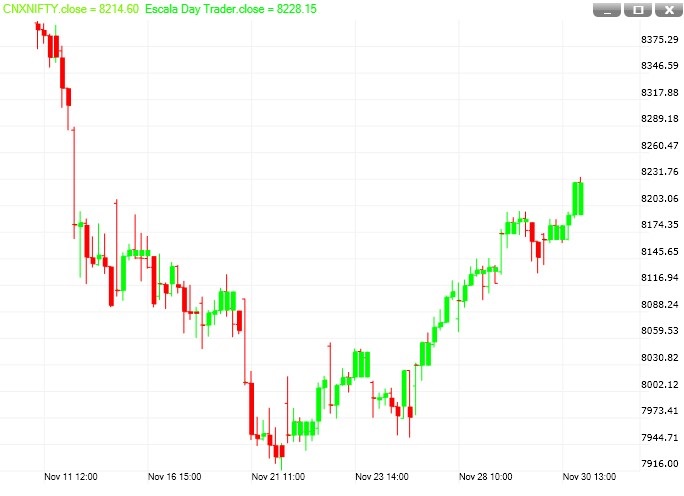
Escala Strategy depicts the market direction. It is a trend follower and, because all the well-known rules of support/resistance, trend-lines, time frames, double or triple tops/bottoms, ascending/descending triangles and retracements apply, the trader will quickly and easily grasp the messages the market conveys.
Escala is a charting style, an Indicator and a trading system in itself. It embodied the thinking found in the modern-days trend following systems.
The basic concept is to buy on the completion of a green line and to sell on the completion of a red one. Buying or selling after the market turned is the preferred choice of trend followers who avoid trying to pick market tops and bottoms, while going with the market flow once a new trend is visible.
The exit signal comes in one of the following ways:
When there is a signal in the reverse direction, i.e. when a trader is long with green lines and a red line appears. This is the real exit signal.
When a profit target is being arrived at or on a trend-line violation, making it unnecessary to wait for a real exit signal to be flagged or,
When the market fails to move according to expectations.
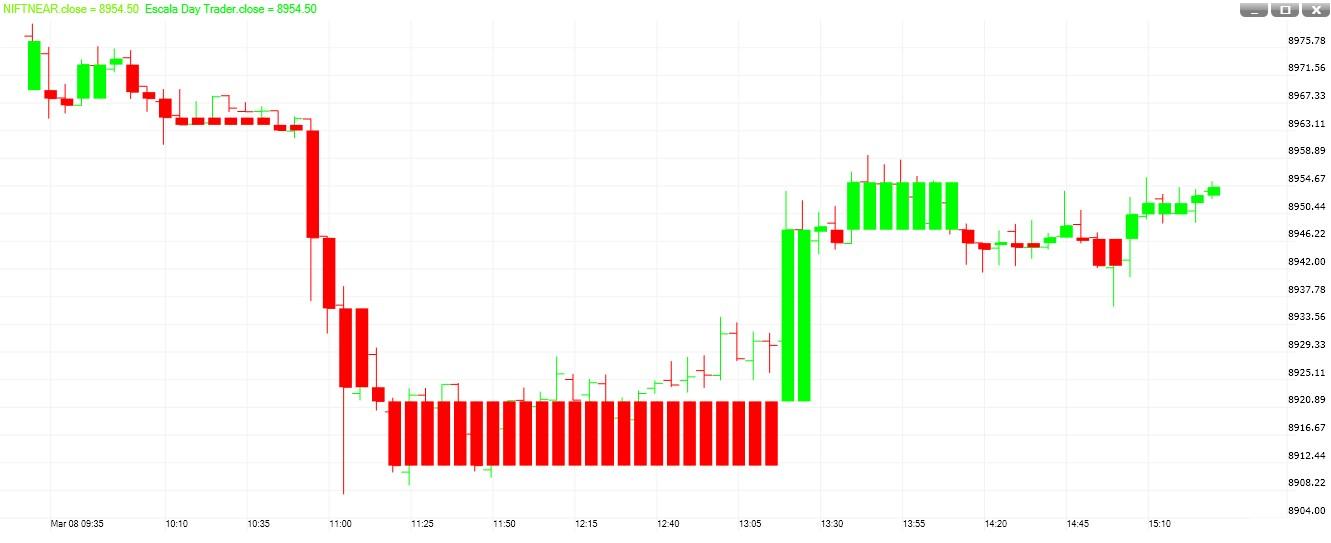
For INTRADAY Chart
For intraday trading, the Escala chart is setup to calculate the trend from today's open. This prevents the previous day from influencing today's analysis. Intra-day rule: on a 5-minute chart, if green lines outnumber the red ones by 10:00 a.m. the day will have a (strong) bullish bias implying that only long positions must be entered into throughout the day whenever bottoms occur. Conversely, if red lines outnumber the white ones by 10:00 a.m. the day will have a bearish sentiment, implying that only short positions must be entered into throughout the day whenever tops occur.
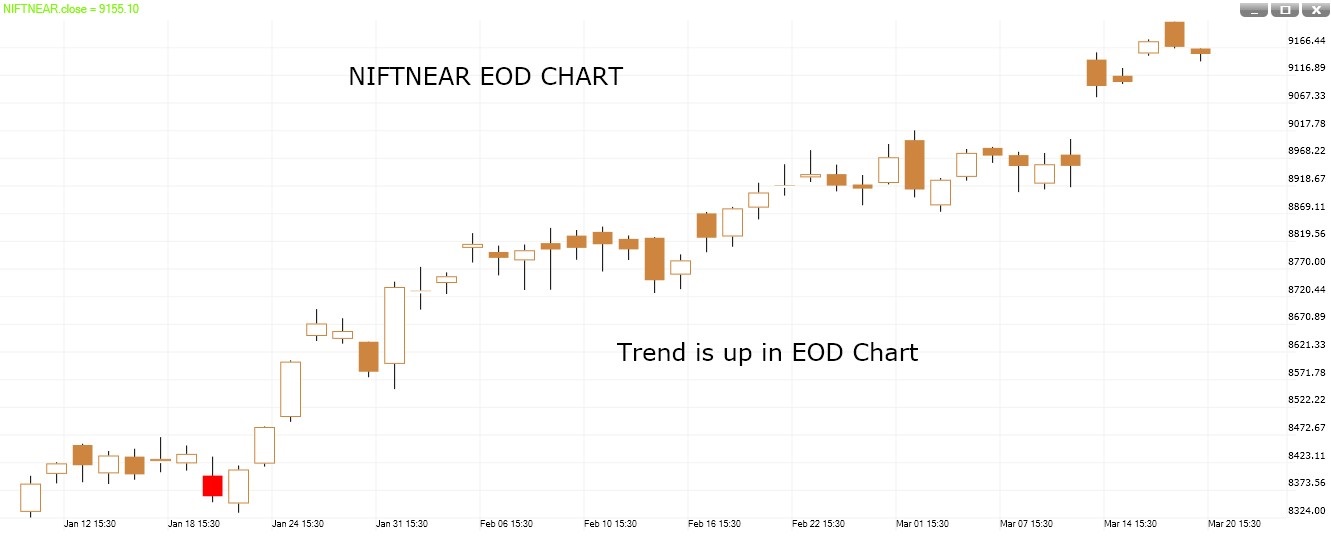
For EOD Chart
Buy when first green bar appears and exit the position if red bar start coming. Sell when first red bar appears and exit the position if green bar start coming. Always use previous bar high and low for placing an entry order...
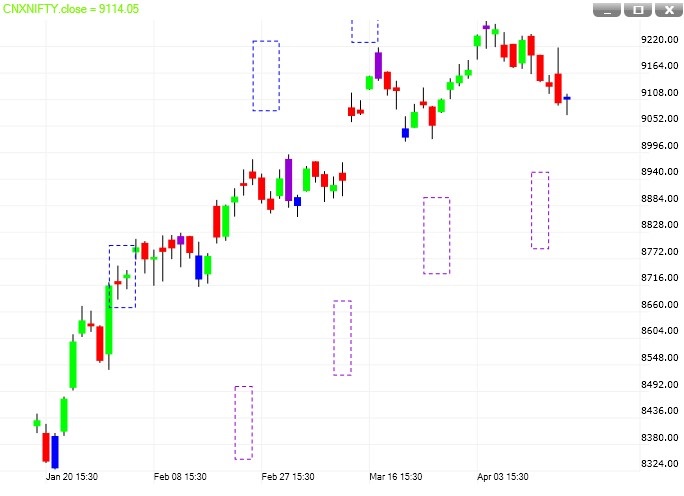
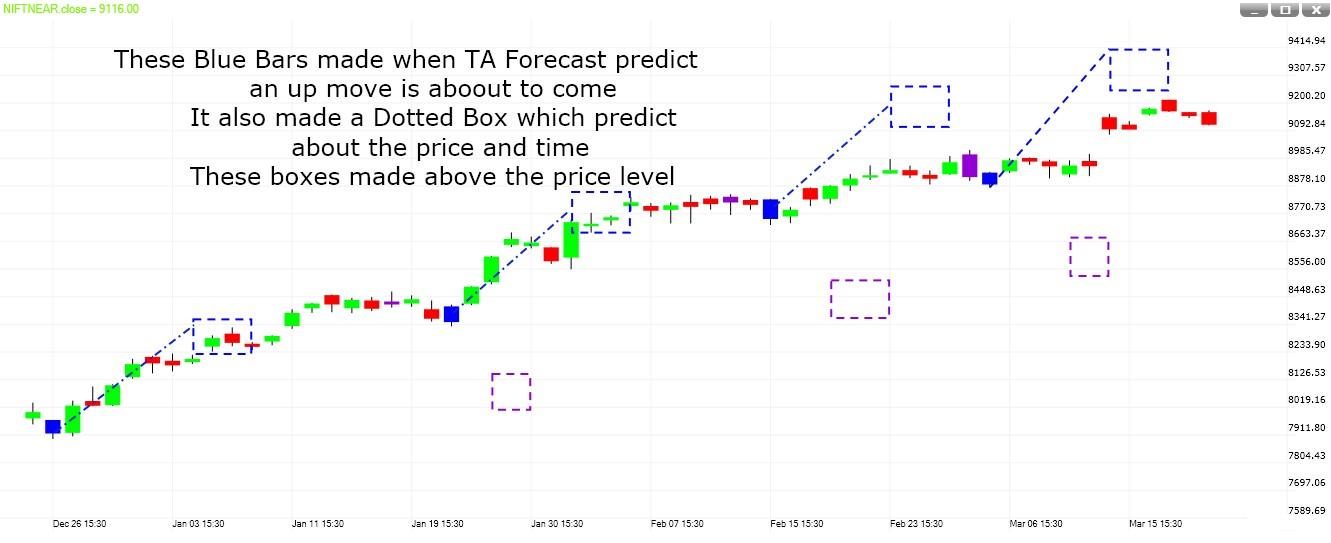
It shows,
(a) Where a stock price can go (Target) and (b) When the target can be reached (Time period).
Properties
TA Forecast has two parts,
(a) Colored bar
(b) Dotted Rectangle
Bars colored after two or three tick.
Boxes should be used for target
Upside – Blue
Blue bar appears when TA Forecast predicts an up move in a stock. When a blue bar made, a blue dotted rectangle is also appear above the price level.
Downside – Violet
Violet bar appears when TA Forecast predicts a down move in a stock. When a violet bar made, a violet dotted rectangle is also appear below the price level.
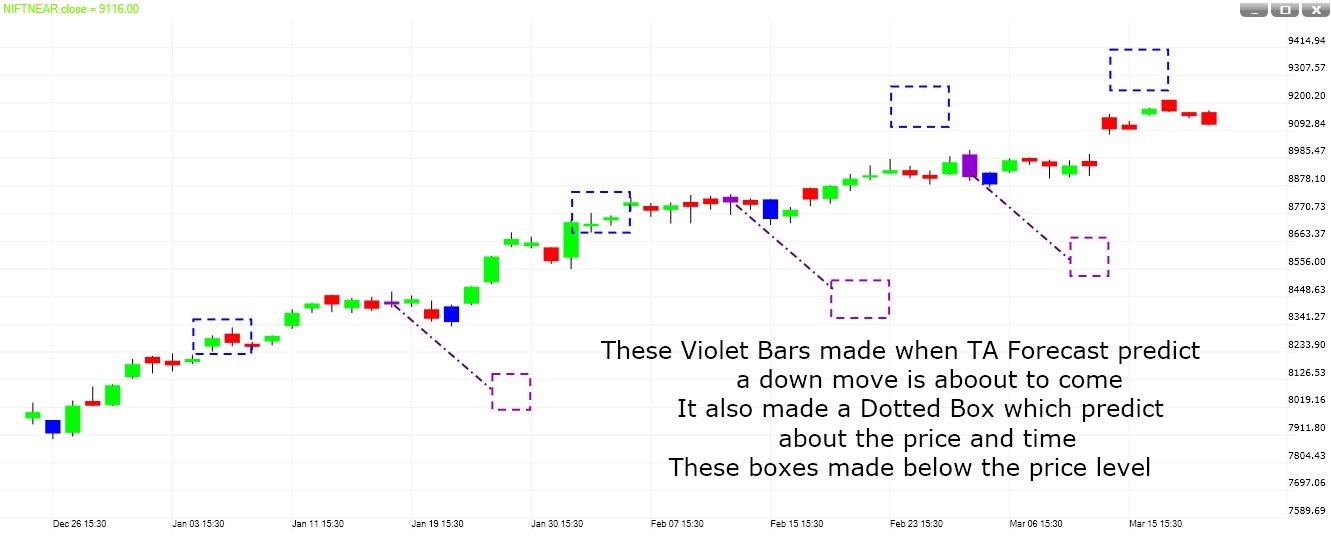
(a) Price: - It refers to expected swing high and low. The vertical lines of the rectangle represent the range of the stock price i.e. a stock can reach between these price levels.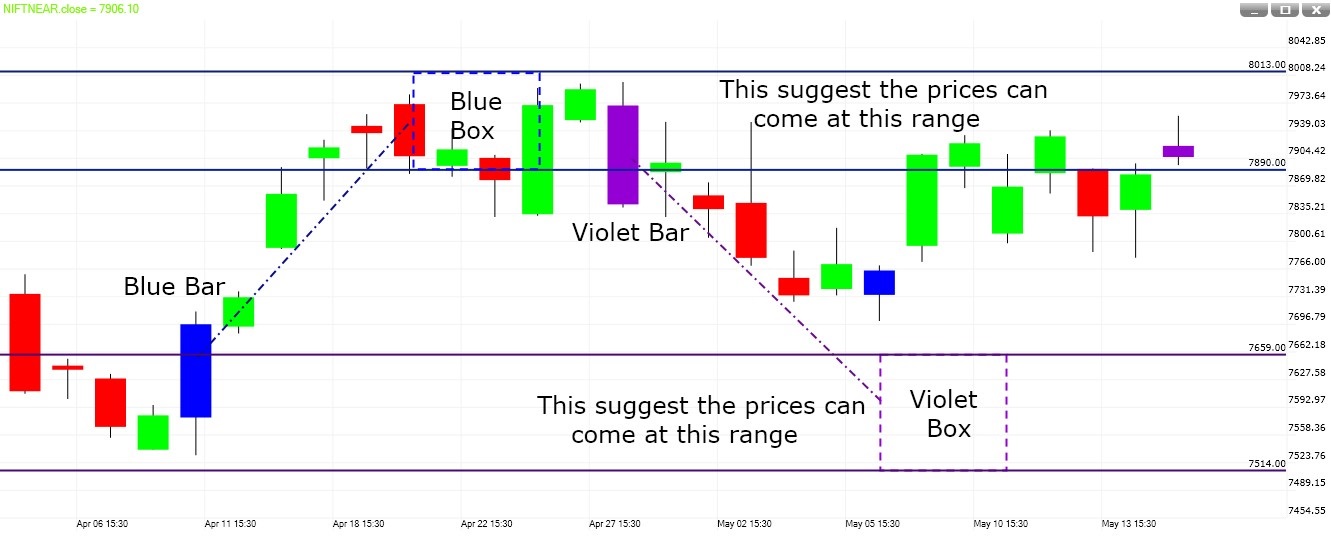
(b) Time: - Time zone in which high and low will be made. The horizontal lines of the rectangle represent the range of the time i.e. when a stock price can make a high or low.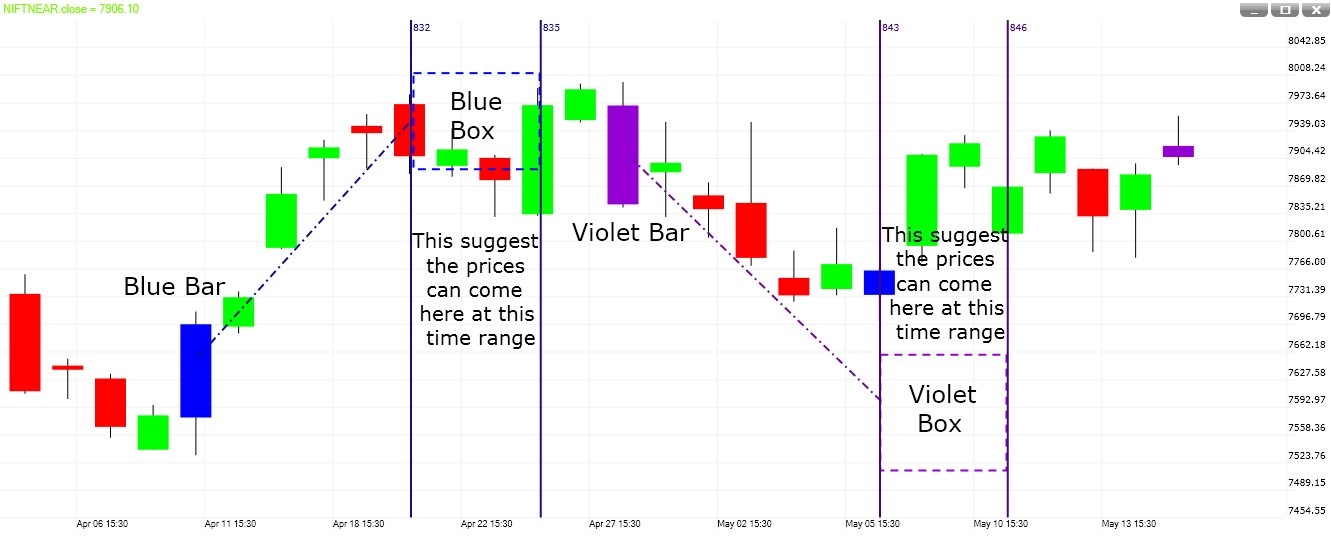
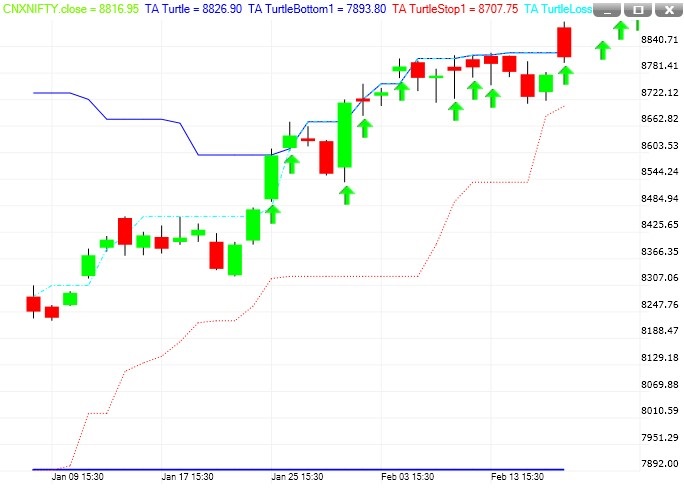
TA Turtle is a Complete Trading System. It covers every aspect of trading, and leaves no decisions to the subjective whims of the trader. It has every component of a Complete Trading System. It covers each of the following decisions required for successful trading:
a) 55 bar breakout line: This is the deep blue line. This line is drawn as a channel. The top line connects the highest 55 bar highs while the bottom line connects the lowest 55 bar lows. To clarify, this line actually consists of two lines.
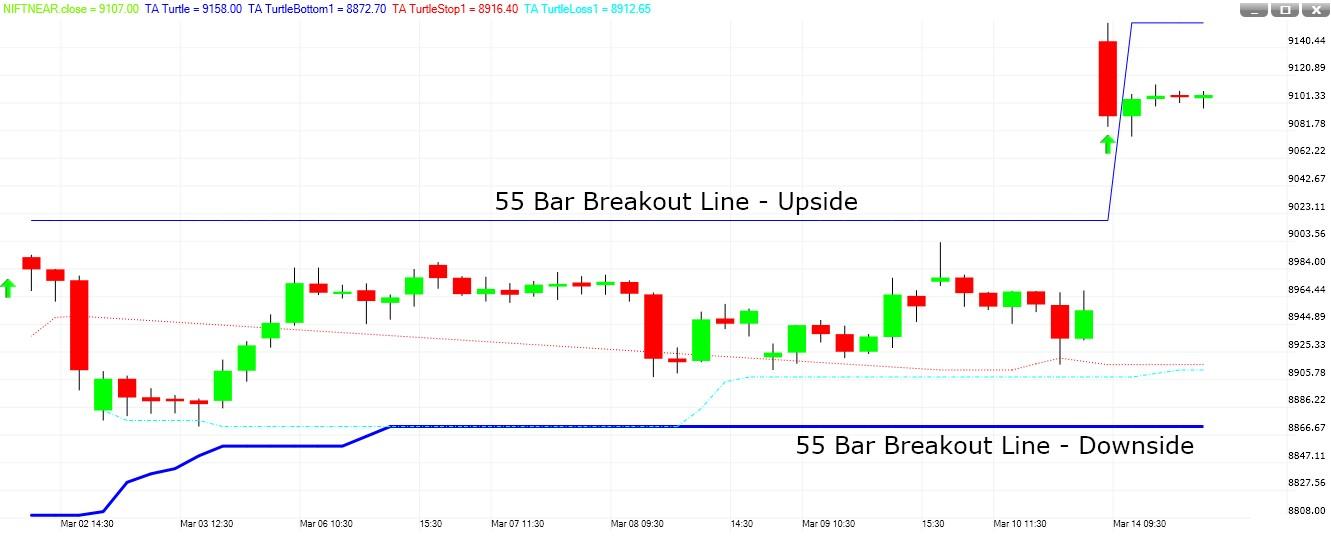
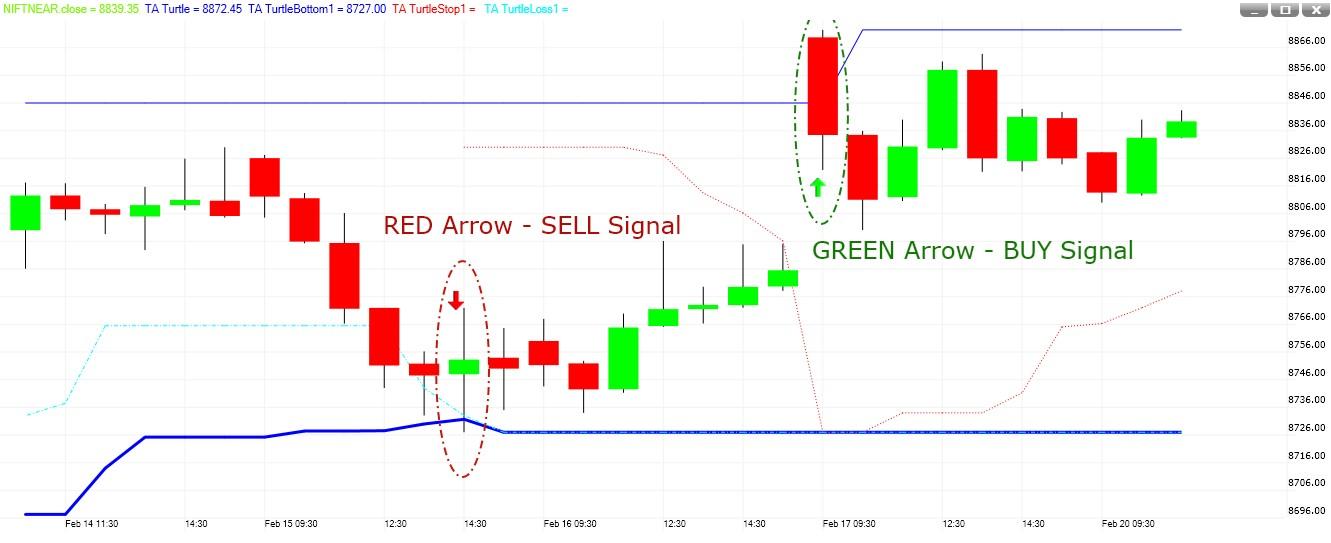
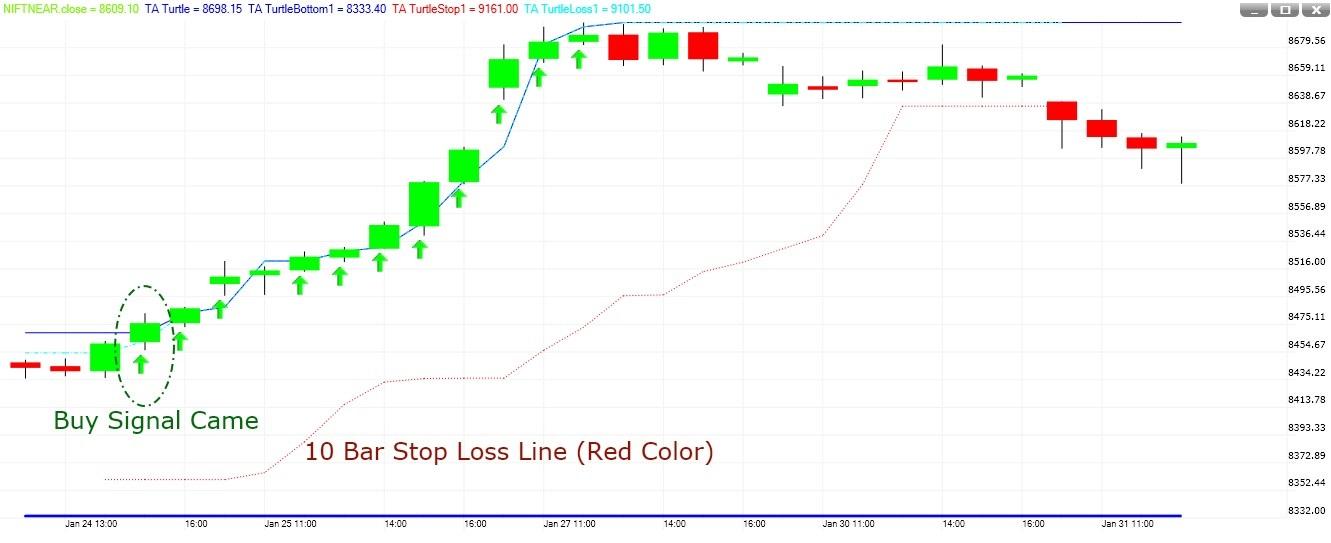
When prices cross the top line, a buy is triggered. An arrow (green) is placed at the bar where the buy is triggered. When prices cross the bottom line, a sell is triggered. An arrow (red) is placed at the bar where the sell is triggered.
10 bar stop loss line: This is the Red dotted line. When a position is taken with the 55 bar breakout / 20 bar breakout after loss, this line is visible giving a stop loss.
20 bar breakout which is called the one loss entry line: This is the line with color - Cyan. (Cyan is light bluish). This line is drawn when the software detects a loss in the opposite direction.
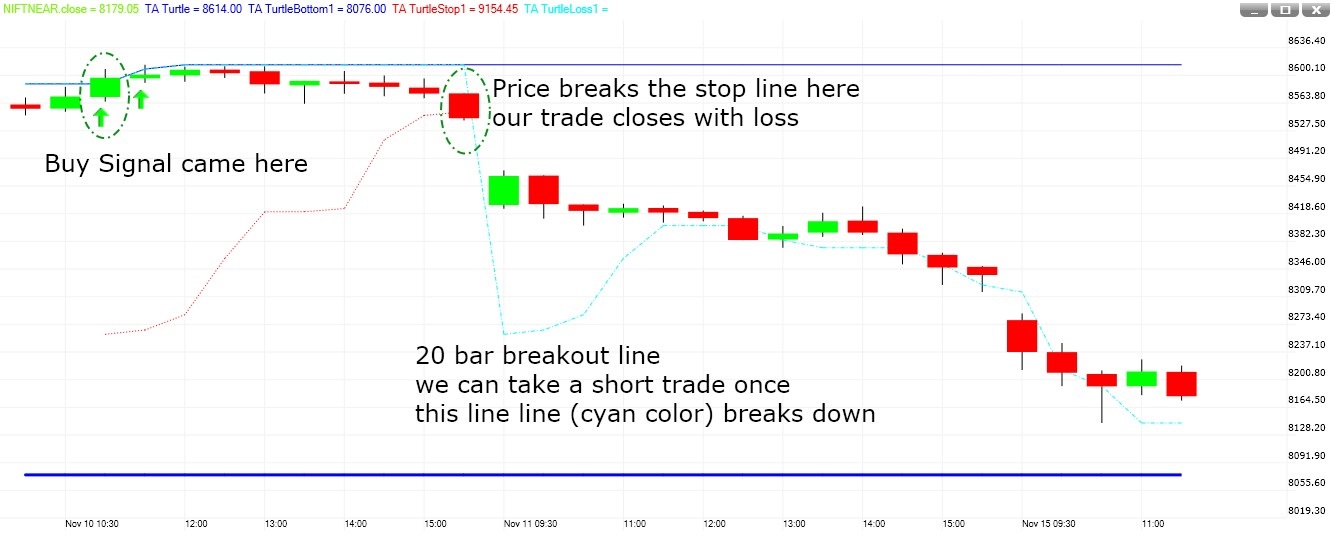
Rule 1: Always enters on a 55 bar breakout.
Rule 2: You may also get in on a 20-bar breakout if the previous trade was a losing trade in the opposite direction. Trade when prices break cyan line. Cyan Line identifies the loosing trade.
Rule 3: Multiple Arrow - Once there is a profit in one direction, you can continue to trade in that direction with 55 bar and 20 bar breakouts, but to trade in the opposite direction with 20-bar, there must first be a loss (rule 2).
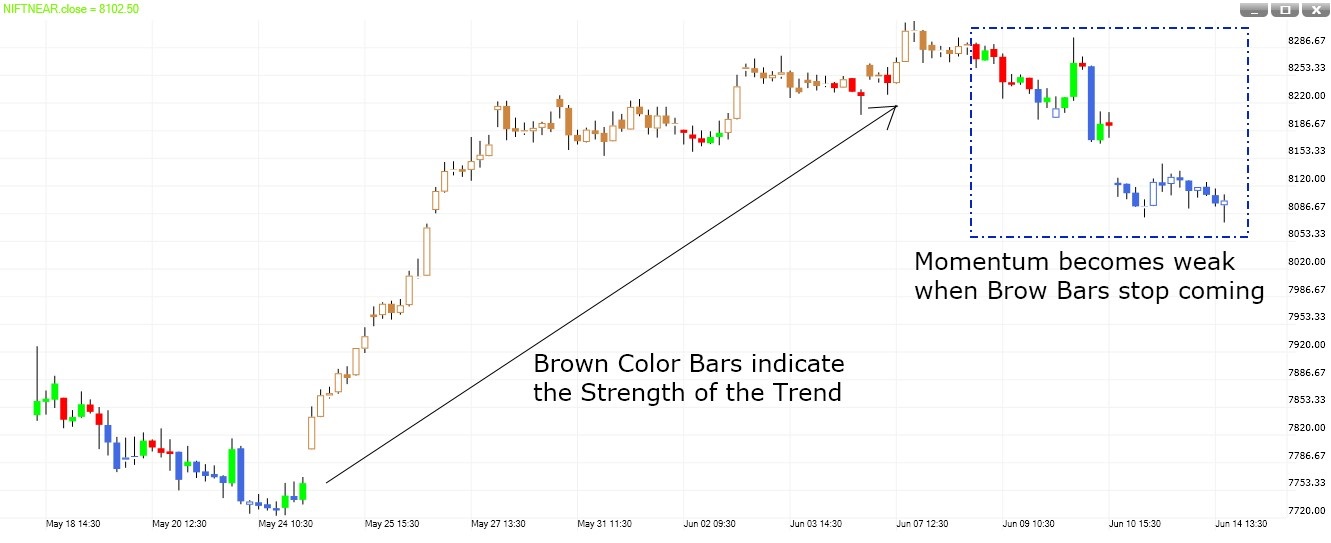
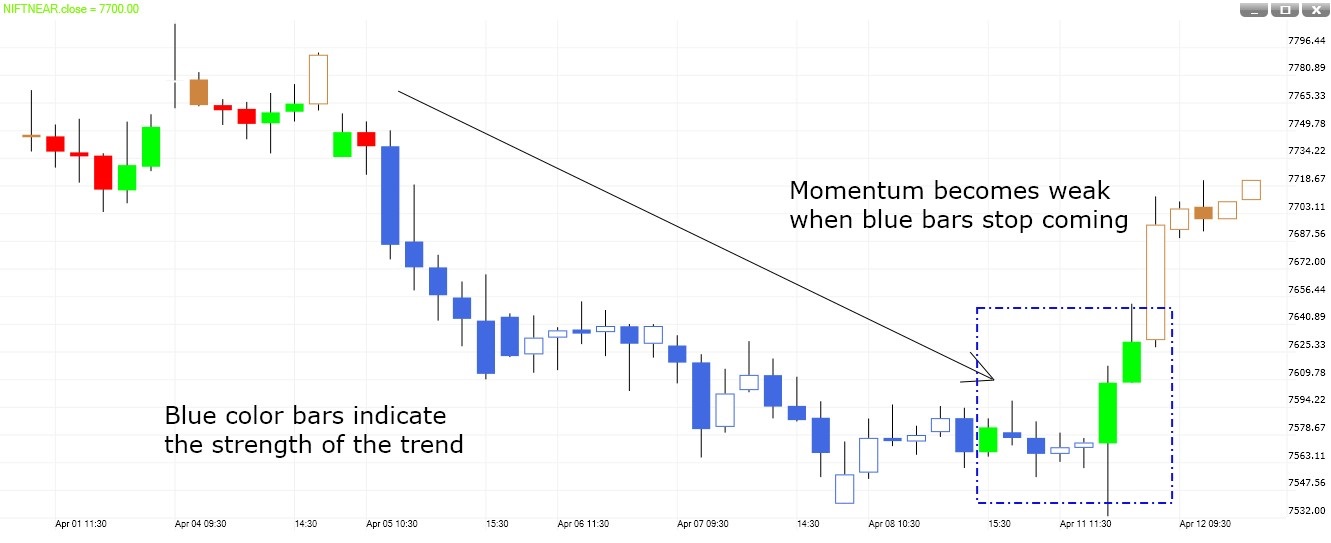
The Trend Energy shows the current trend and also identifies the pullback in a trend.
It can be used to identify buying and selling opportunities for dips as well as breakouts.
Set up
Trend Energy has two colored bars.
(a) In an uptrend
Brown color bar represent trend.
Blue color bar represent pullback.
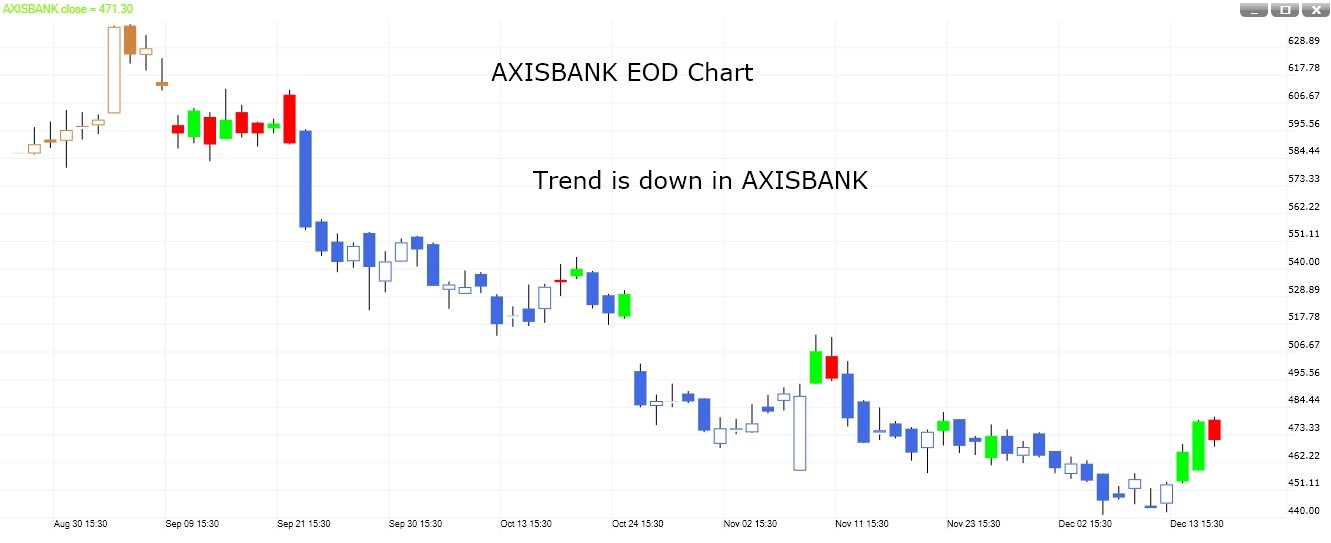
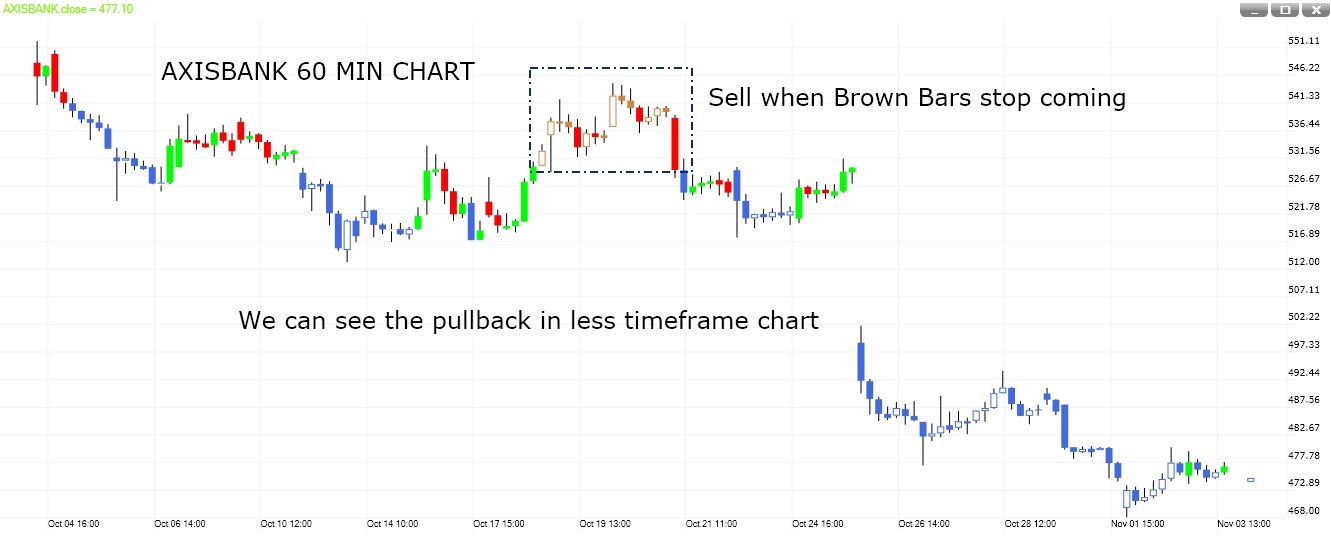
(b) In a downtrend
Blue color bar represent trend.
Brown color bar represent pullback.
Type 1-Buy: Buying in strength
Type 2-Buy: Buying in Pullback
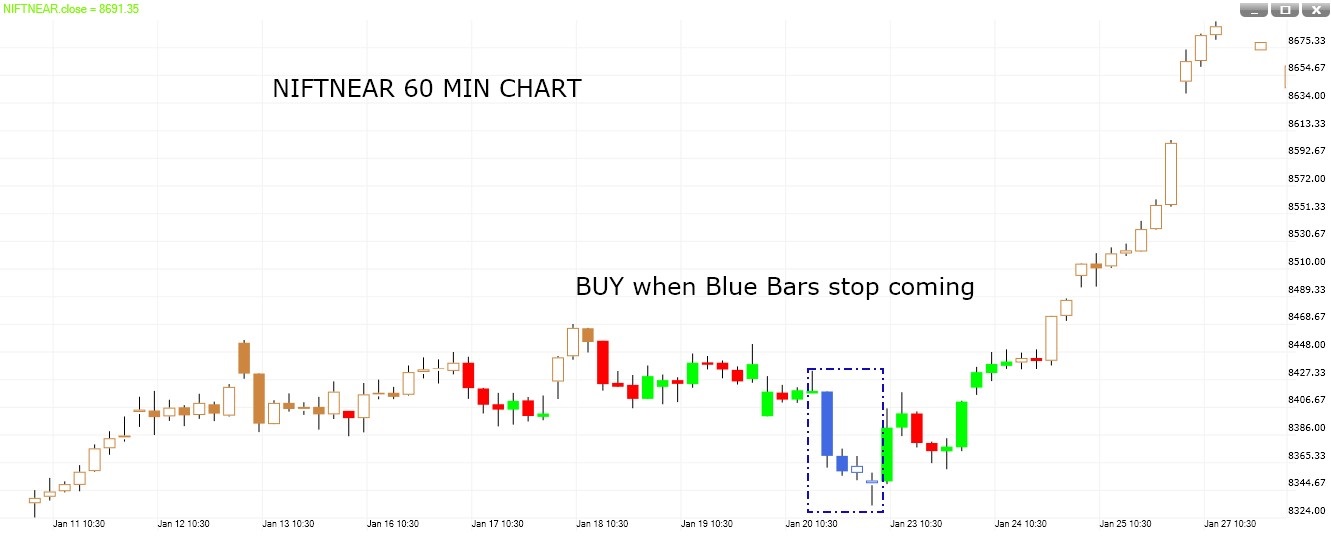
Type 1-Sell: Selling in weakness
Type 2-Sell: Selling in Pullback
In an uptrend, buying is possible with Brown bars (breakouts) and Blue bars (dips).
In a downtrend, selling is possible with Blue bars (breakdowns) and Brown bars (rallies).
Always try to buy above previous high and sell below previous low.
This can save you from many whipsaws.
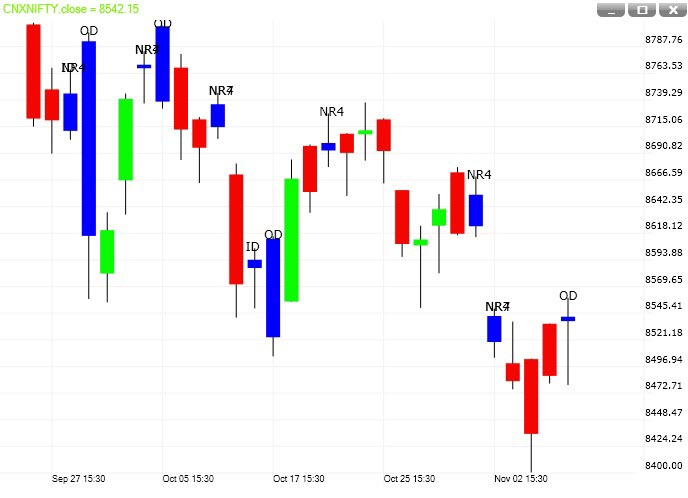
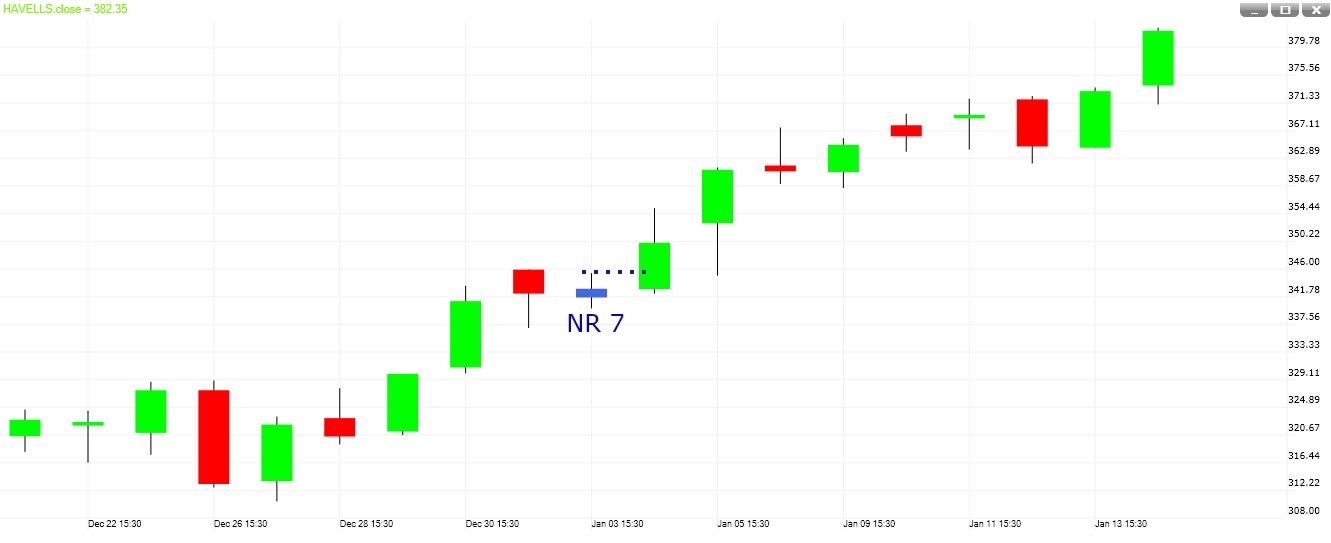
NR 7:
This bar pattern requires seven bars. If the last bar has the smallest bar range within the sequence, it is an NR7 pattern. Bar range refers to the difference between the high and the low of a bar.
It indicates decreasing volatility. As the lower volatility comes within the context of seven bars, the NR7 pattern is a stronger sign of decreasing volatility. As the market alternates between range contraction and range expansion, the NR7 alerts us to standby for explosive moves.
How do we trade it?
Buy break-out of the high of the last bar.
Sell break-out of the low of the last bar.
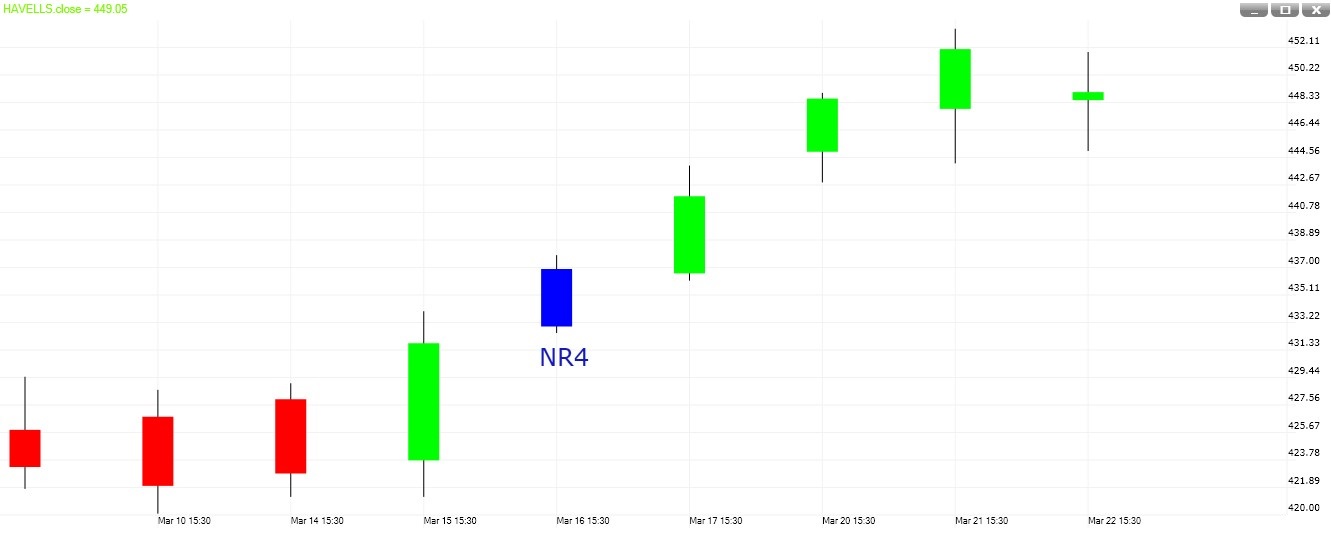
NR 4
This bar pattern requires four bars. If the last bar has the smallest bar range within the sequence, it is an NR4 pattern. Bar range refers to the difference between the high and the low of a bar. It indicates decreasing volatility. As the market alternates between range contraction and range expansion, the NR4 alerts us to standby for explosive moves.
How do we trade it?
Buy break-out of the high of the last bar.
Sell break-out of the low of the last bar.
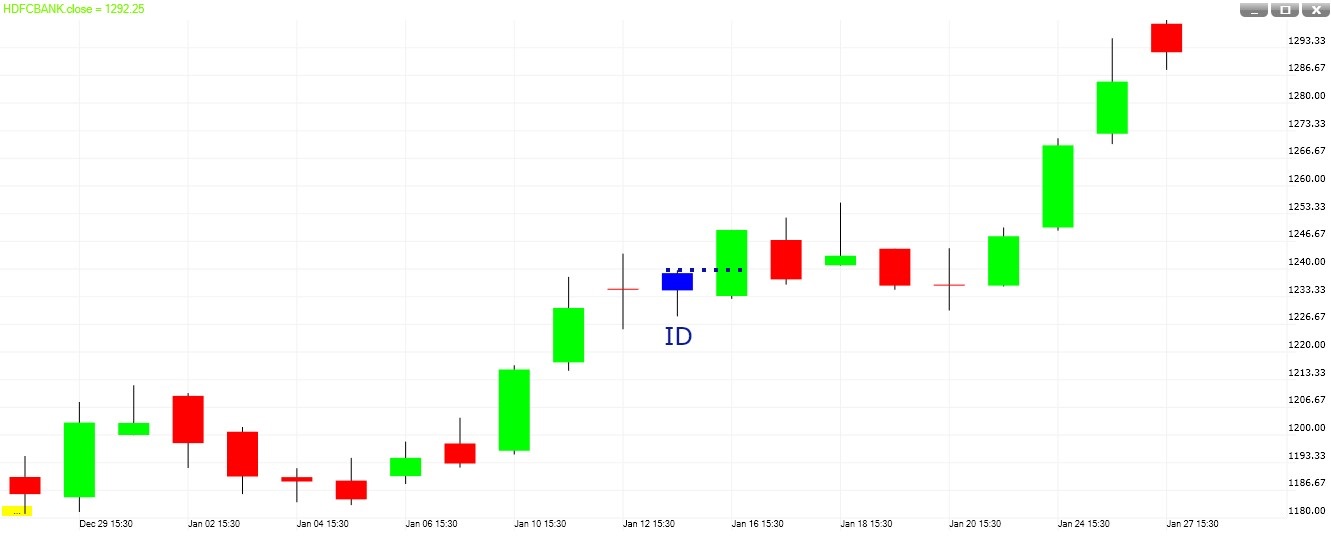
INSIDE DAY
An inside bar must stay completely within the range of the bar immediately before it. In other words, the second bar must have a lower high and a higher low compare to the previous bar.
It is a pause in price action and does not show clear strength in either direction.
How do we trade it?
Place a buy stop order above its high and a sell stop order below its low. Once one order is triggered, cancel the other.
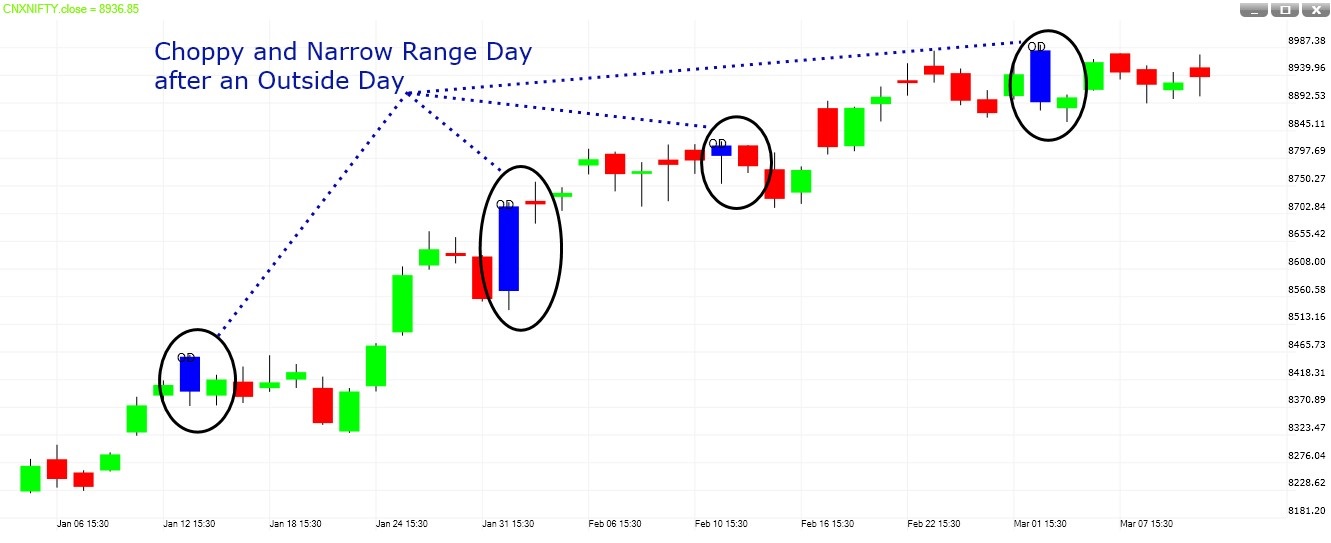
OUTSIDE DAY
Its range must exceed that of the previous bar with a higher high and a lower low.
It is a short-term expansion in price range/volatility. It shows strength in both directions.
In most cases, it is uncertain if the bulls or the bears have won. The only certainty is the increased volatility.
How do we trade it?
It is wise to avoid trading next day as chances of a choppy or narrow range day is higher after an outside day.
INTRODUCTION
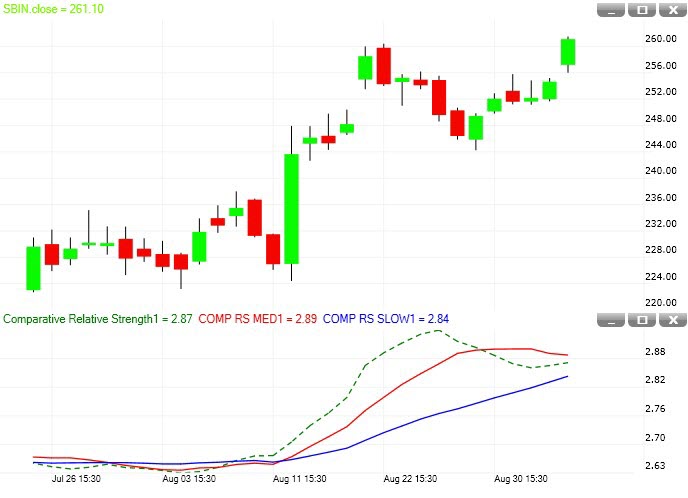
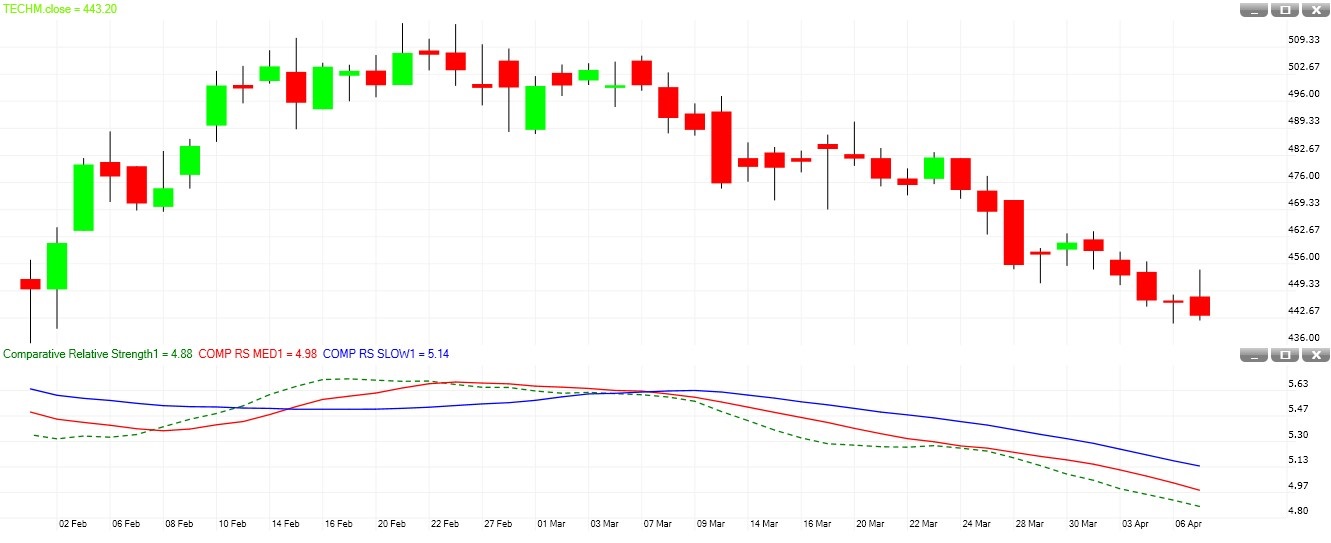
Comparative Relative Strength is an indicator that allows a comparison of the price movement of a stock with another stock, sector, or index.
Comparative Relative Strength compares two securities to show how the securities are performing relative to each other. Be careful not to confuse Comparative Relative Strength with the Relative Strength Index.
INTERPRETATION
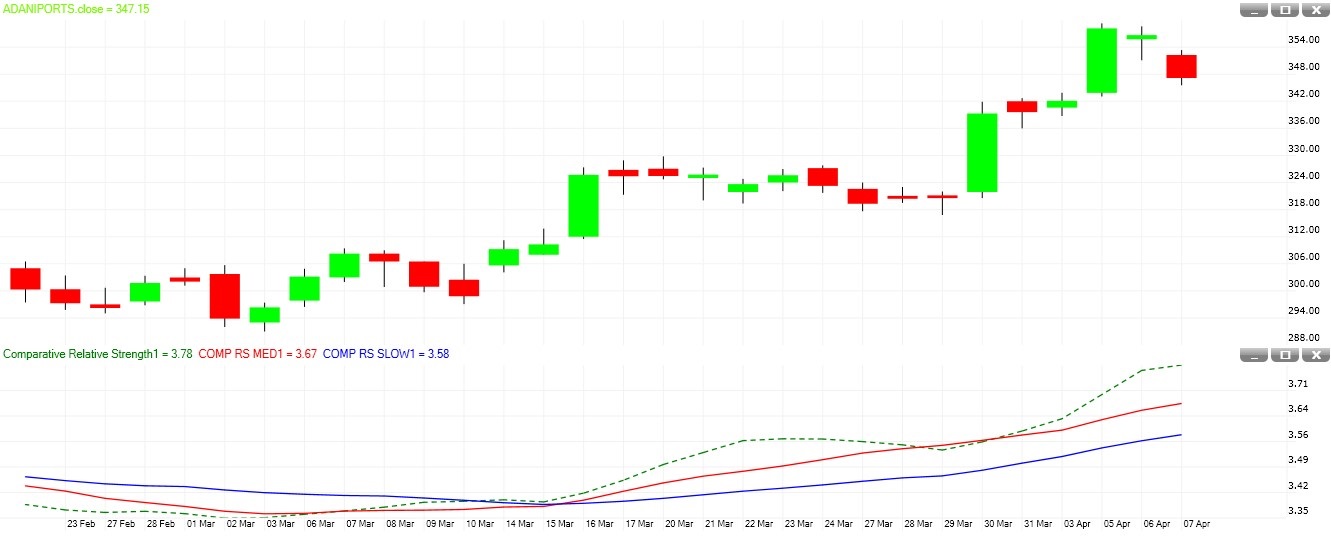
Comparative Relative Strength compares a security's price change with that of a "base" security. When the Comparative Relative Strength indicator is moving up, it shows that the security is performing better than the base security.
When the indicator is moving sideways, it shows that both securities are performing the same (i.e., rising and falling by the same percentages).
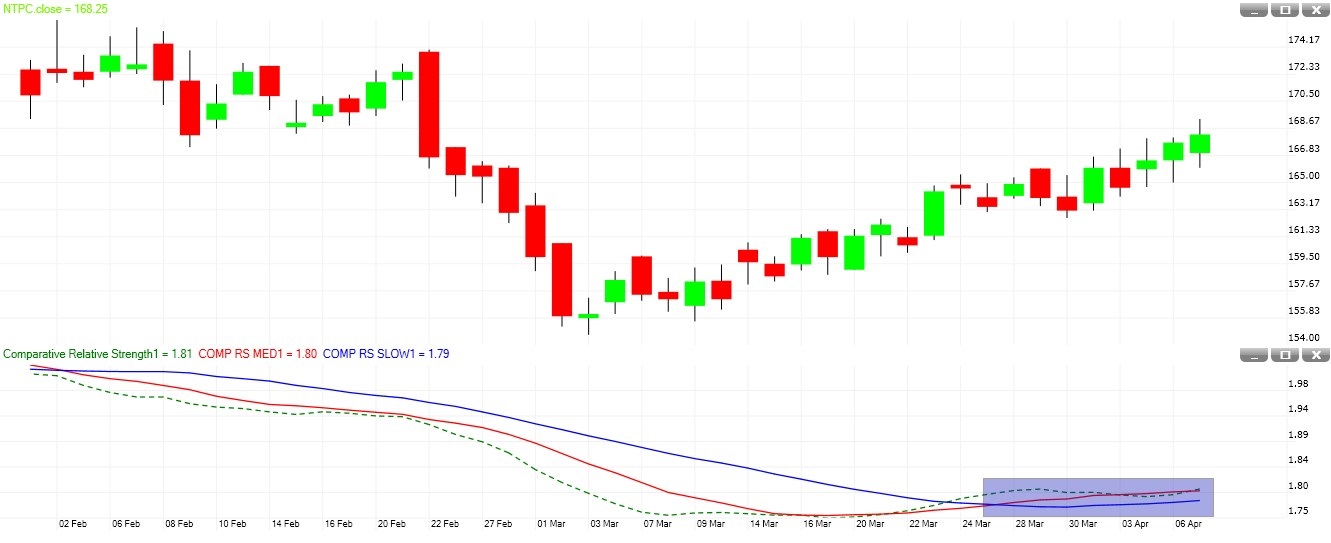
When the indicator is moving down, it shows that the security is performing worse than the base security (i.e., not rising as fast or falling faster).
SUMMARY:
A simple use is to measure the strength of a stock's current trend versus that of the general market. An alternative use is when comparing two potential investments and trying to determine overall which one has the strongest overall trend. Comparative Relative Strength is often used to compare a security's performance with a market index. It is also useful in developing spreads (i.e., buy the best performer and short the weaker issue).
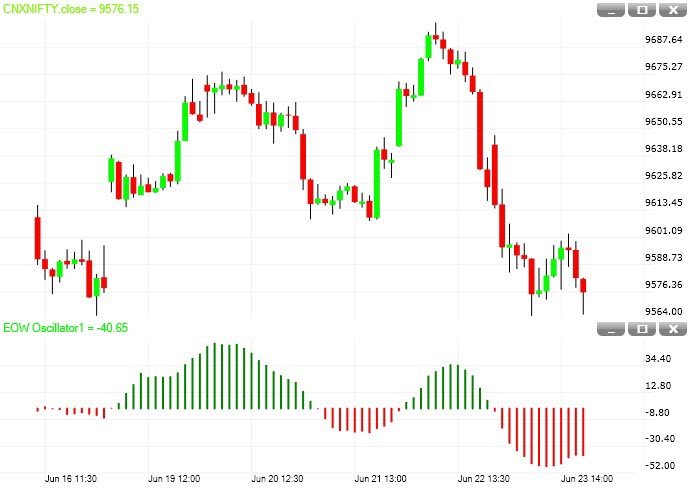
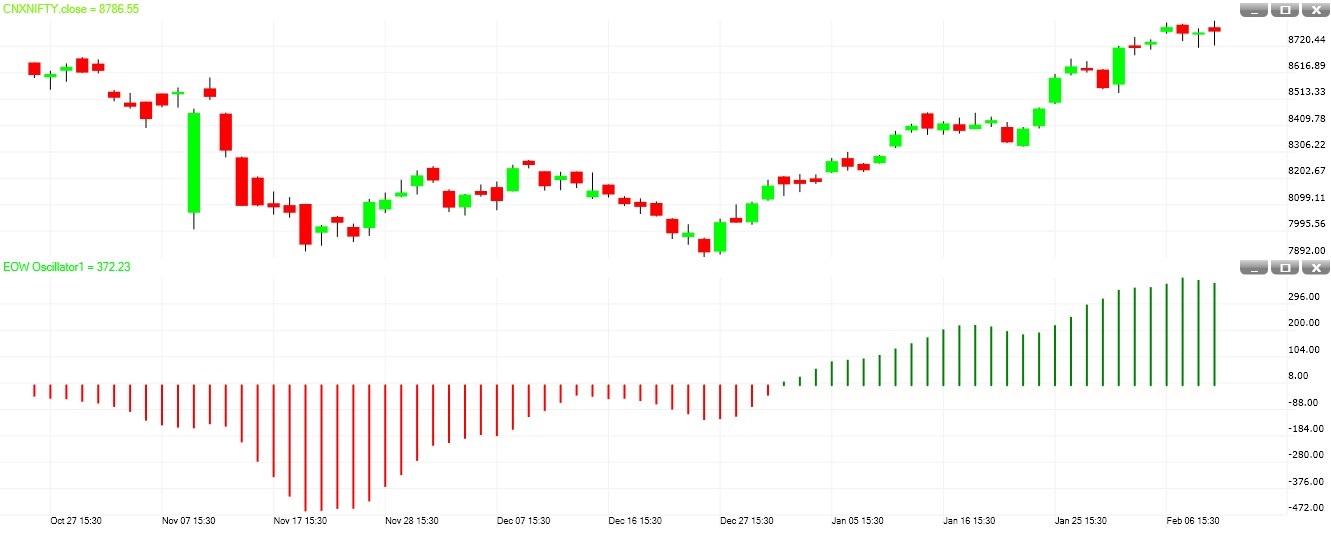
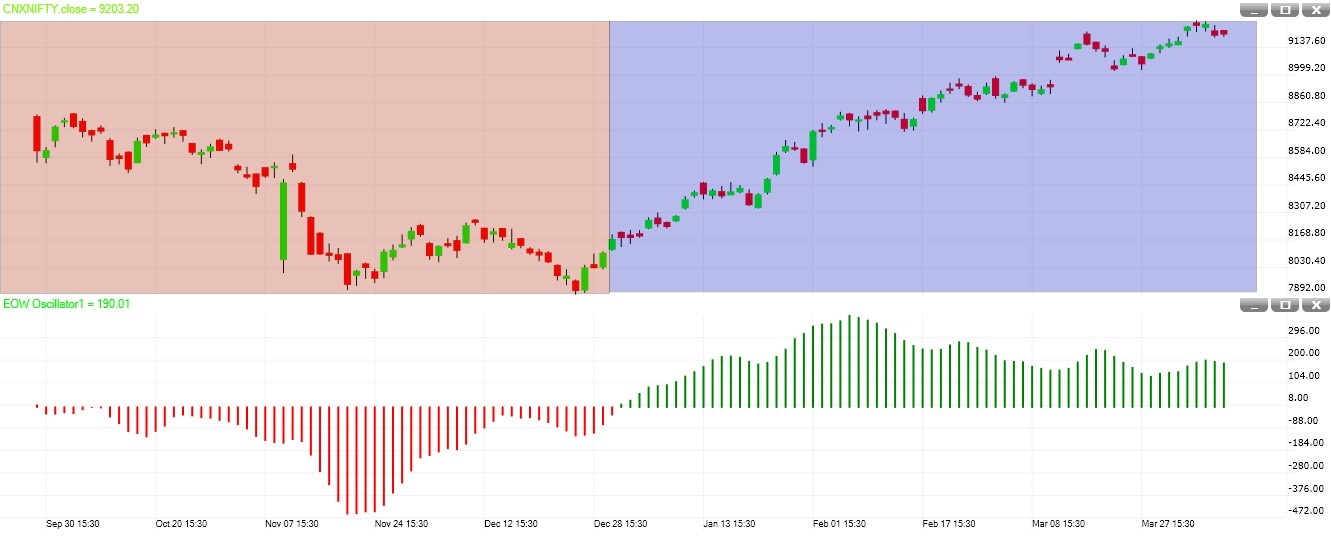
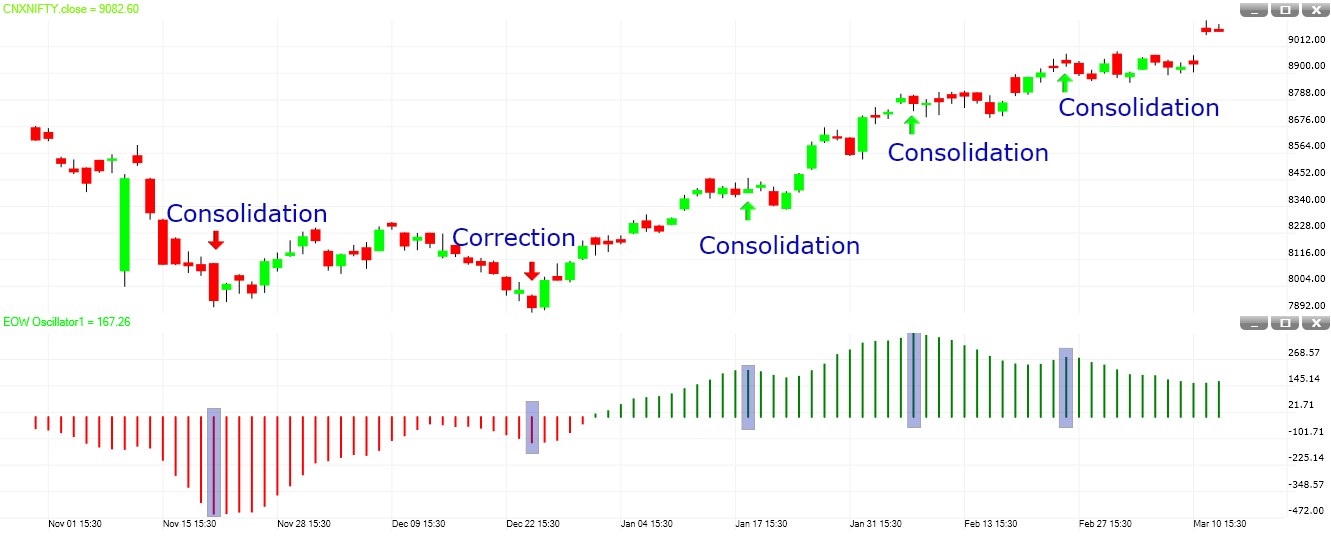
It is a difference of 5 and 35 days SMA. It should be plotted as a histogram.
Trend Recognition
Green Histogram suggests trend is up whereas Red Histogram suggests trend is down.
Buy on Dip OR Sell on Rally
Once we establish a trend then we can look for a trade within. If trend is up then we can look for buy on dip when green histogram first decrease the value and then increase the value.
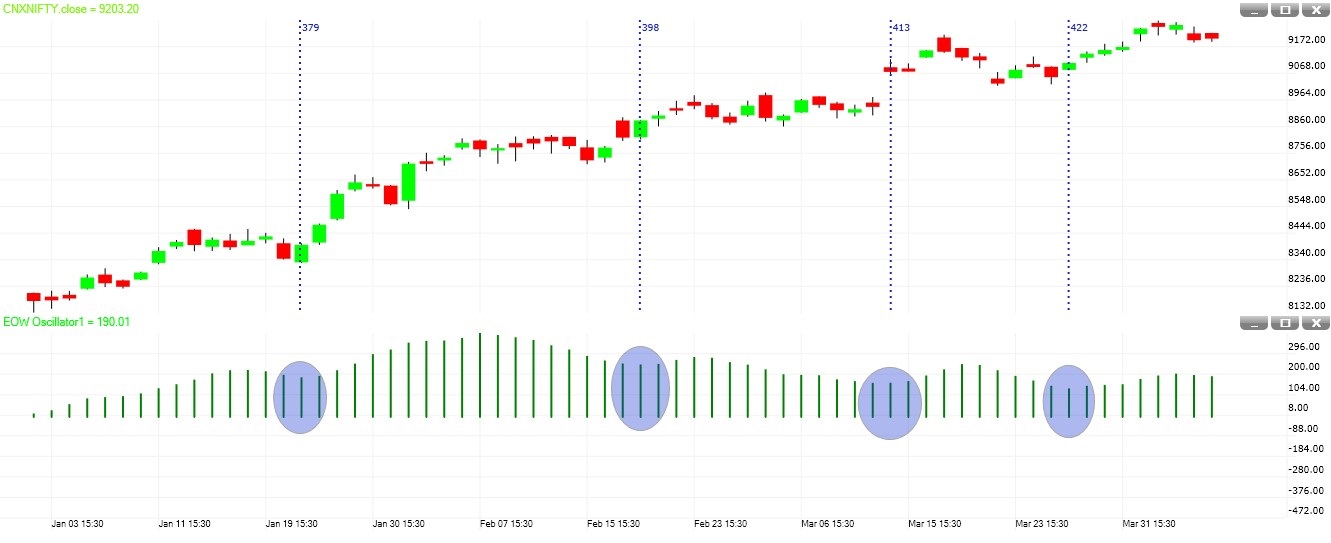
If trend is down then we can look for sell on rally when red histogram first increase the value and then decrease the value.
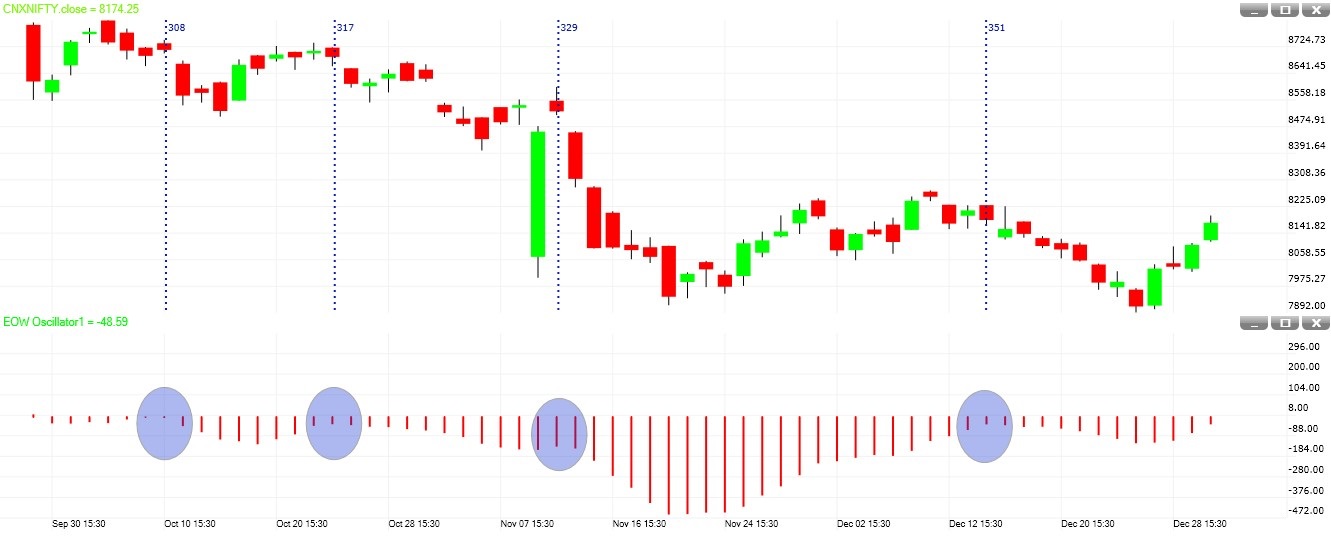
Sign of a consolidation/correction
Once the Green or Red histogram made a top or bottom respectively then there is a high chance of a consolidation or correction.
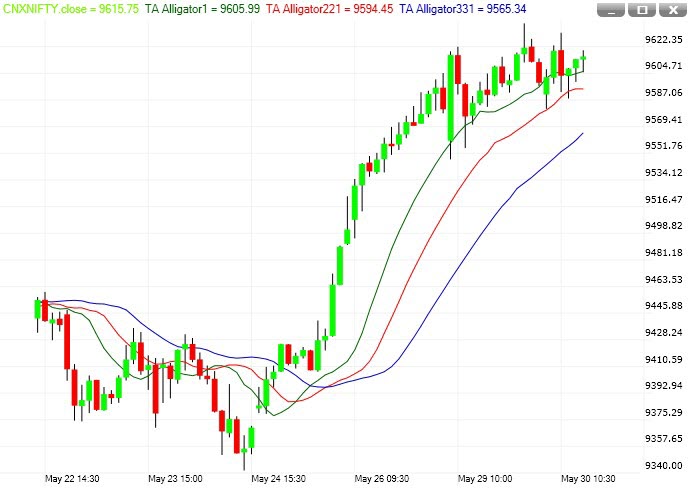
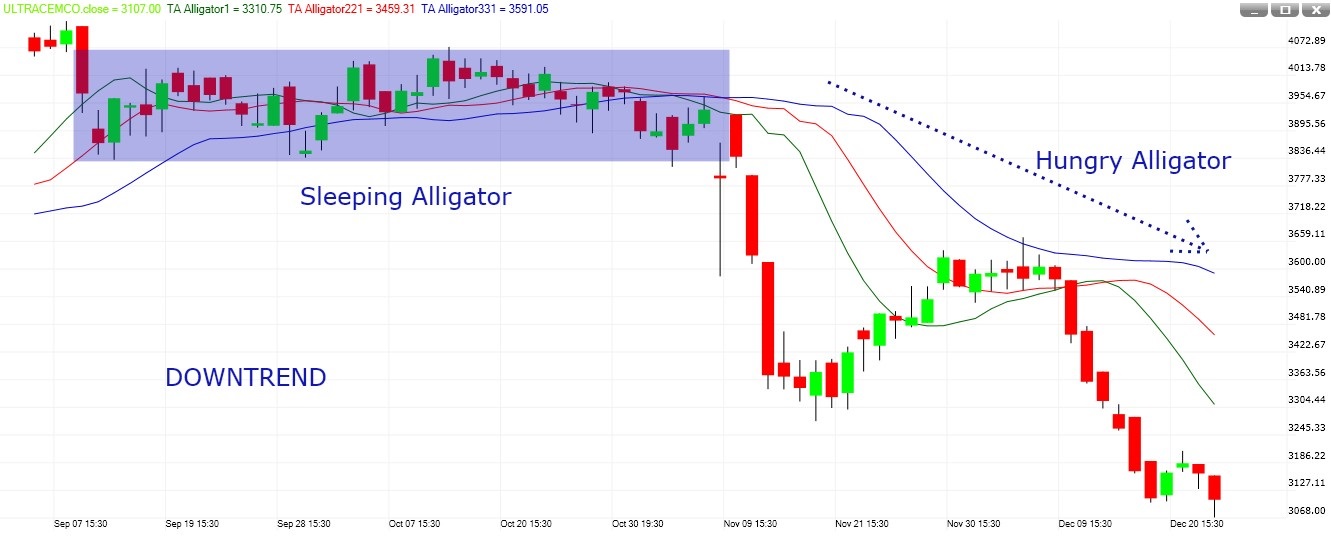
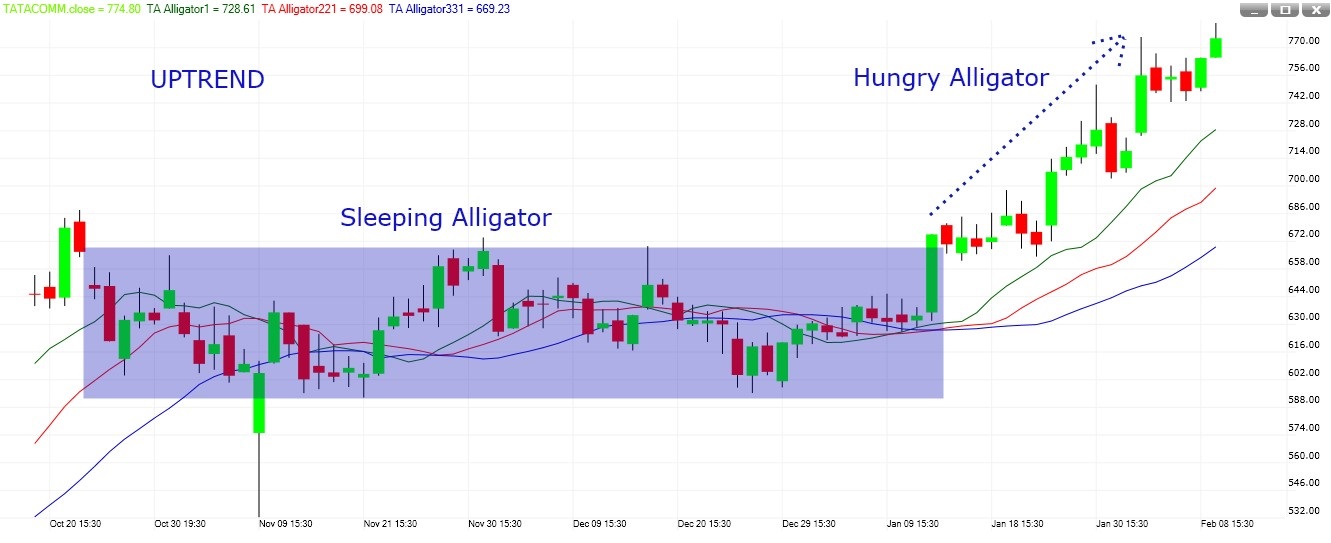
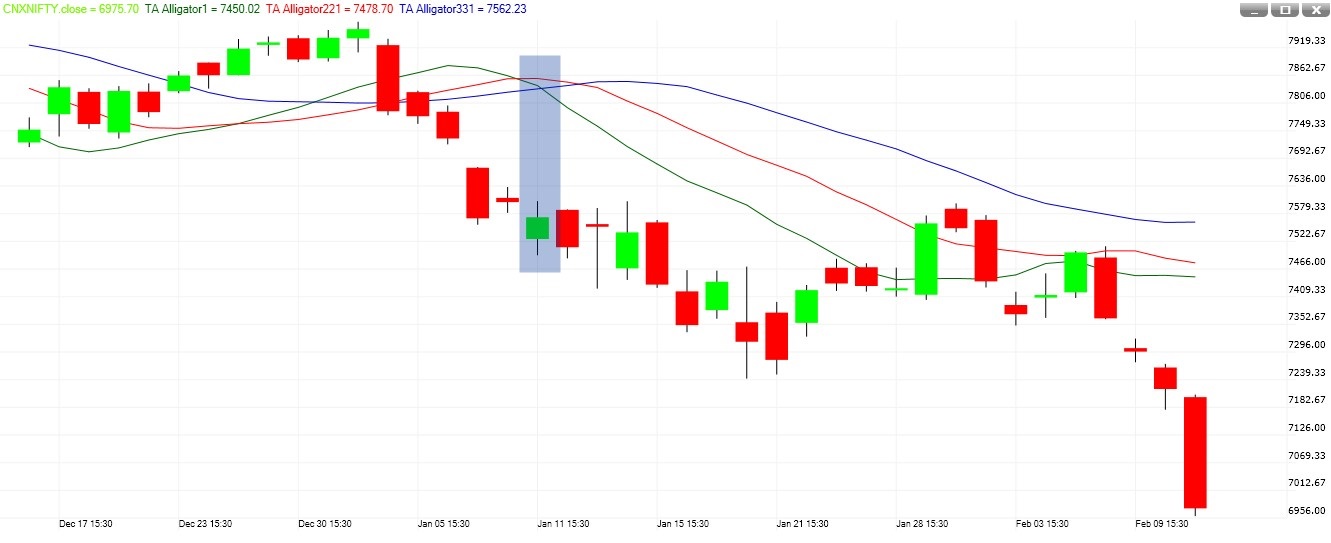
The Alligator is a set of three smoothed moving average lines. The Alligator is like a compass which keeps your trading in the right direction. The Alligator helps you spot a real trend and stay out of range-bound trading, which always result in losses. The Alligator is the combination of three balance lines viz., the blue line (alligator's jaw), the red line (alligator's teeth) and the green line (alligators lips).
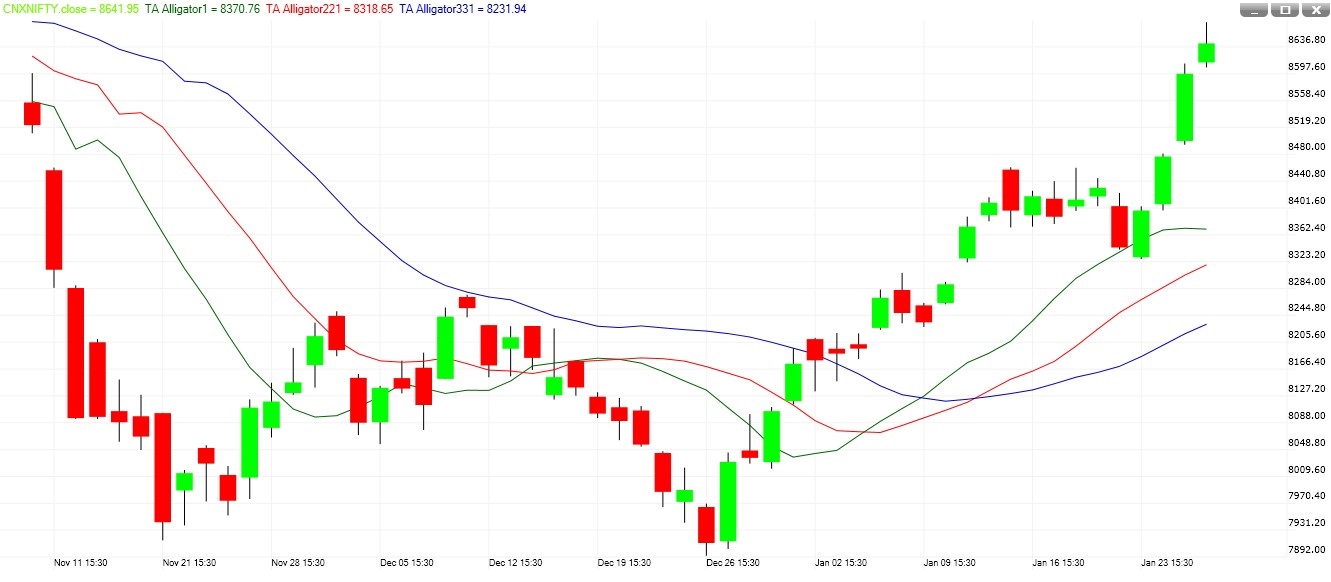
Up Trend: An uptrend is signified when Green line is on the top, then Red line below it, and Blue line at the bottom.
Down Trend: A downtrend is signified when Blue line is on the top, then Red line below it, and finally Green line at the bottom.
No Trend: When the three lines are mixed with each other, traders should avoid trading in this situation.
Sleeping Alligator: When all the 3 lines are mixed with each other and market trade sideways then the alligator called the sleeping alligator.
Hungry Alligator: When all the 3 lines are not mixed with each other and moving in a direction either upward or downward then it’s a sleeping alligator.
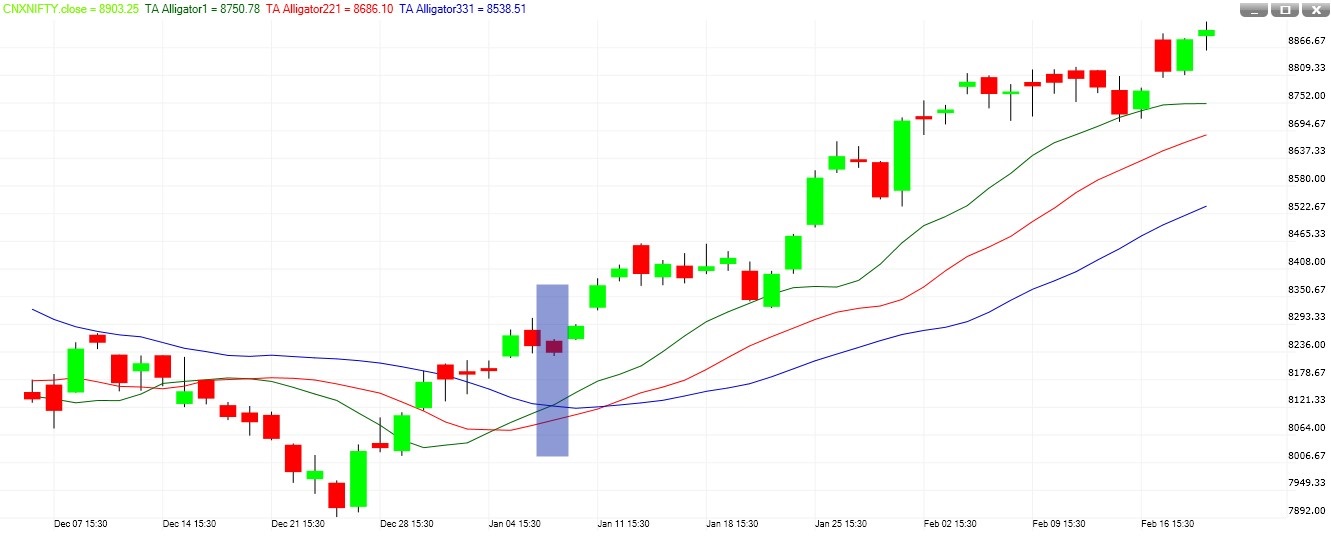
When green line crosses above the other two lines, this is the first sign that an upside move may begin.
When green line crosses below the other two lines, this is the first sign that a decline is possible here.
Best trade comes when the alligator is sleeping.
Use alligator with any momentum indicator for more confirmation.
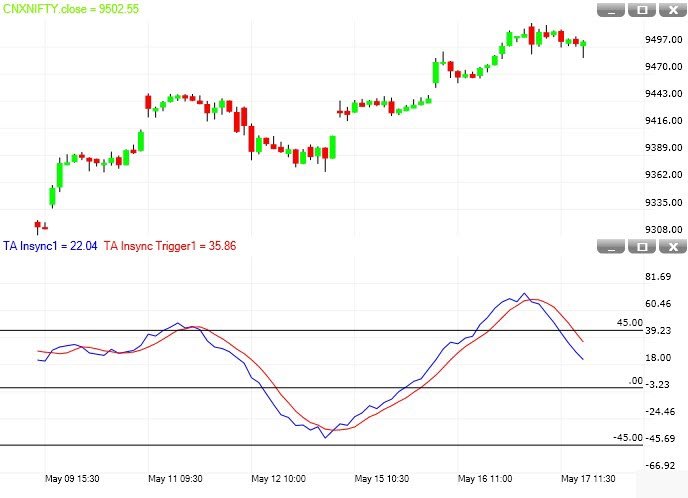
TA Insync combines the best of trend as well as momentum indicators.
TA Insync indicator is a consensus style oscillator (consensus indicators use many indicators to output a value) and helps traders determine extreme levels of stock prices. It shows when a majority of indicators are in sync; suggesting that a turning point is near.
TA Insync indicator oscillates between the two extreme levels.
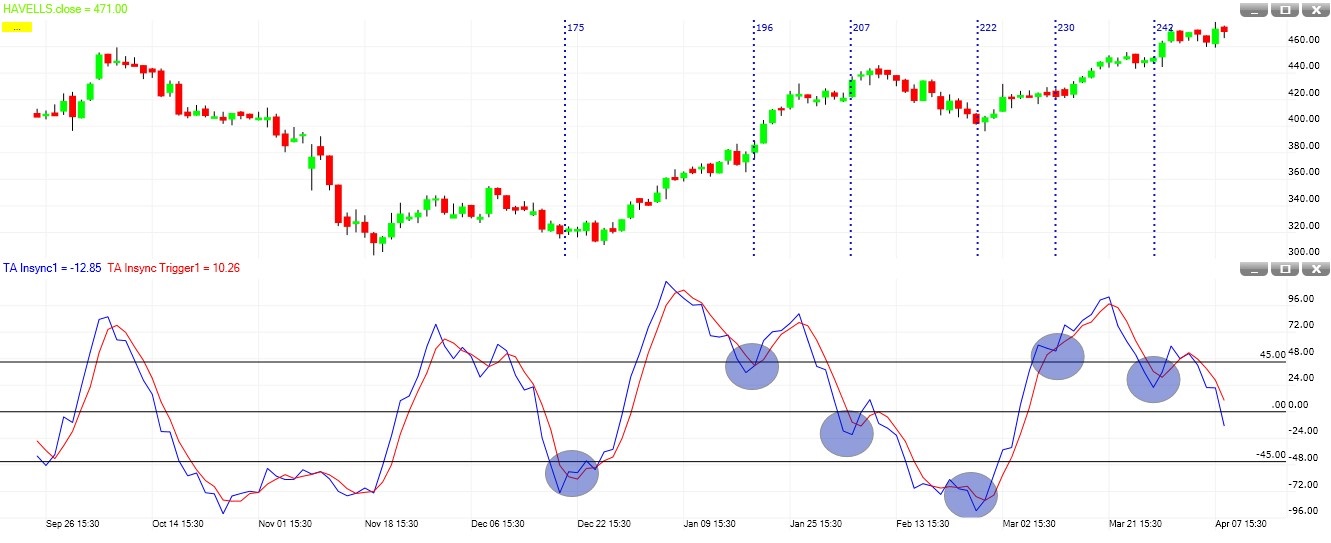
Values higher than +45 are considered to be high extreme level (overbought zone), while values lower than -45 are considered to be low extreme level (oversold zone).
We can use TA INSYNC as a trend indicator. For this we have to use 55 as a Look back period and with smooth by 5 periods.
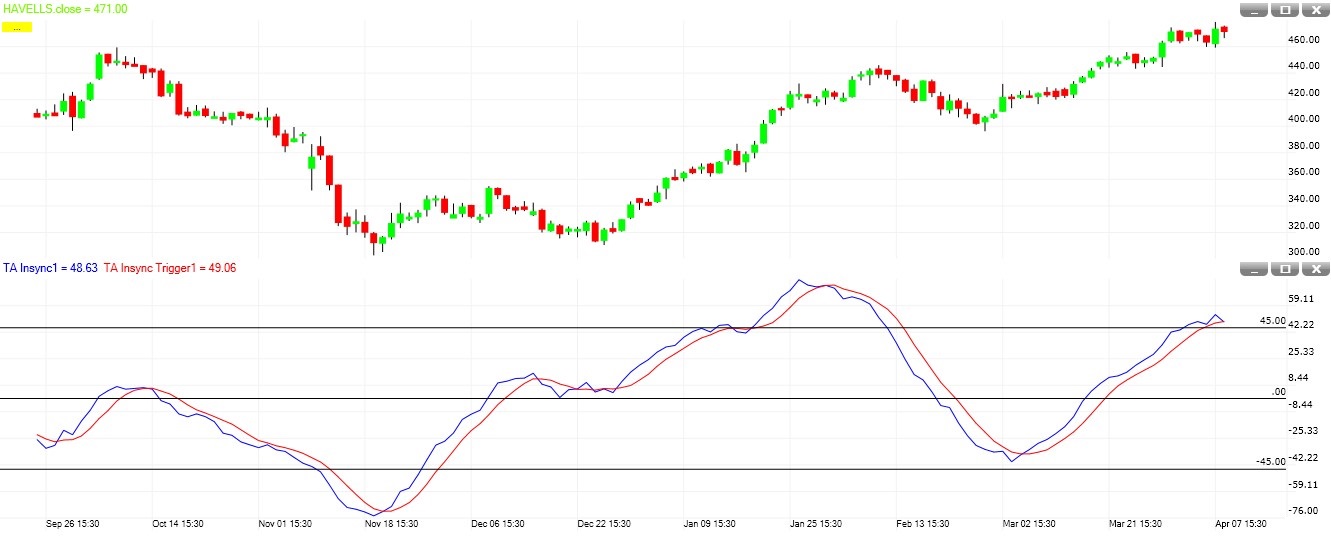
We can use TA INSYNC as a buy on dips in an ongoing uptrend. For this we have to use 13 as a Look back period and with smooth by 3 periods.
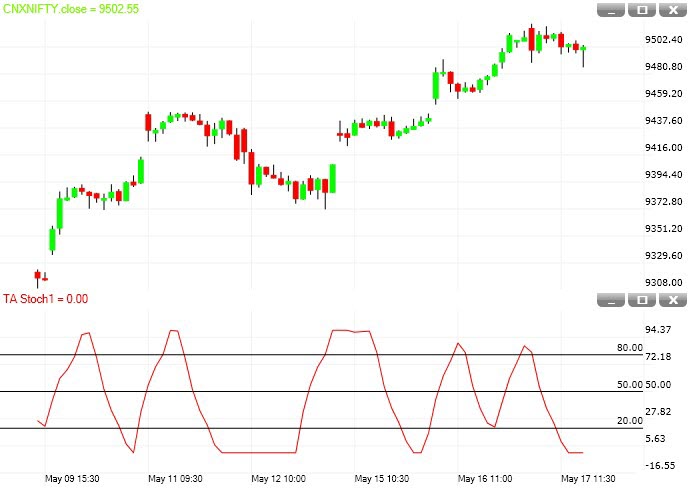
This is a modified version of stochastic. In an Uptrend, Stochastic usually remain in an overbought zone. It does not give any signal of buy on dips in an uptrend or sell on rallies in a down trend.
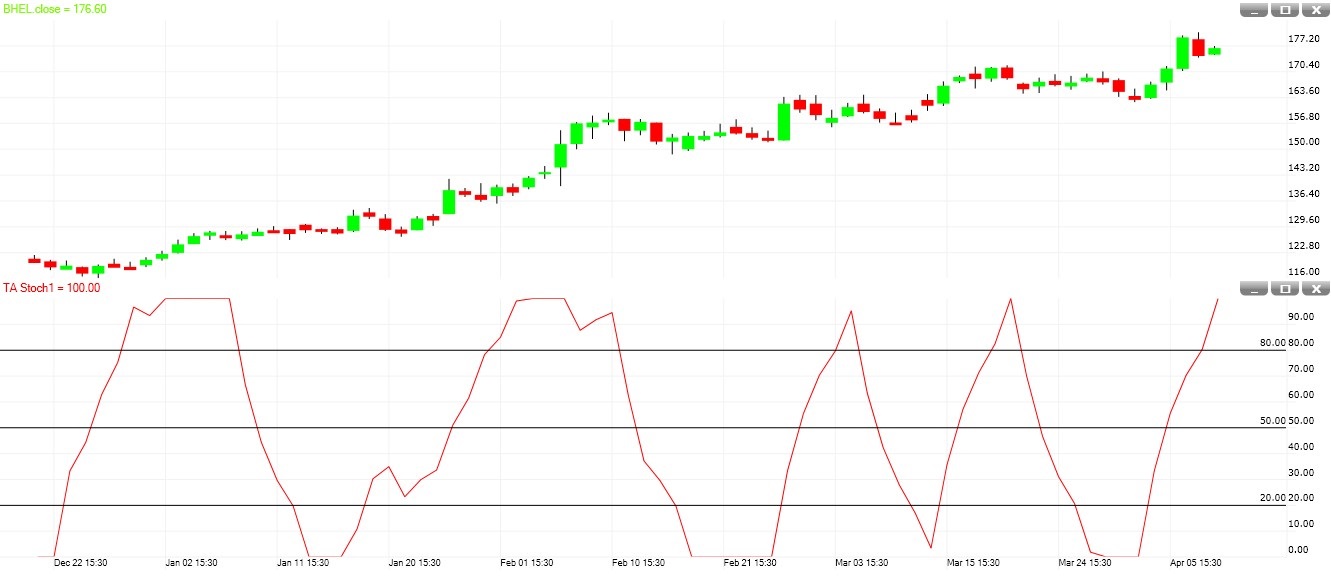
TA stoch moves quickly compare to Stochastic. It gives quick signal of buy on dips in an uptrend or sells on rallies in a downtrend.
If the trend is up then we can buy when TA Stoch comes to Zero (0). A value at zero (0) of TA Stoch suggest short term over sold.
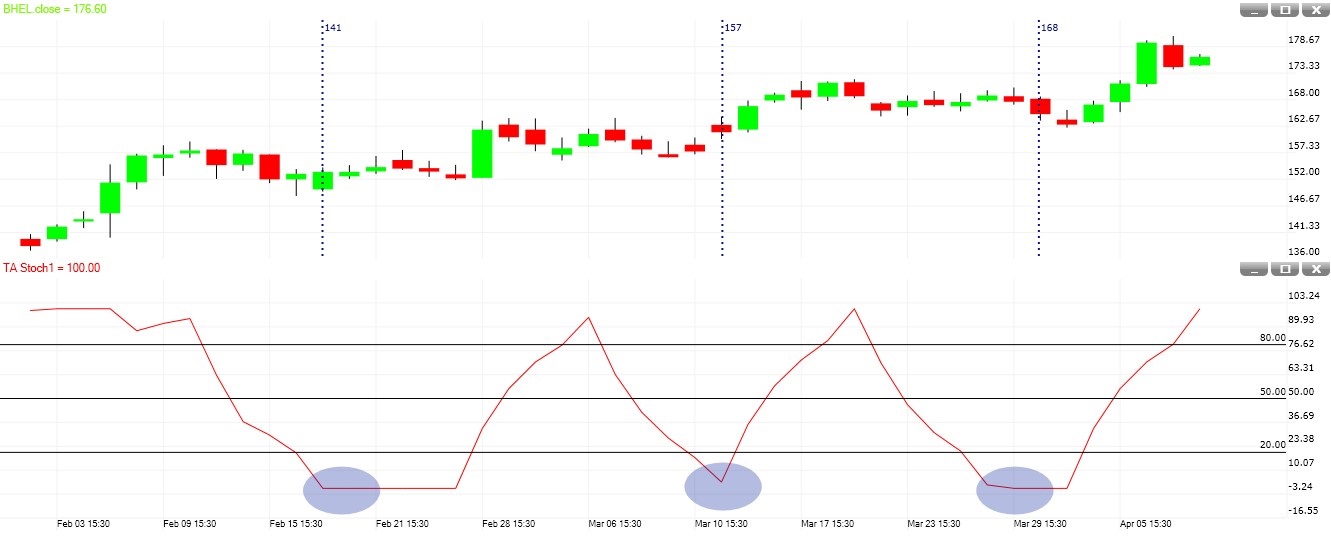
If the trend is down then we can sell when TA Stoch comes to 100. A value at 100 of TA Stoch suggests short term over bought.
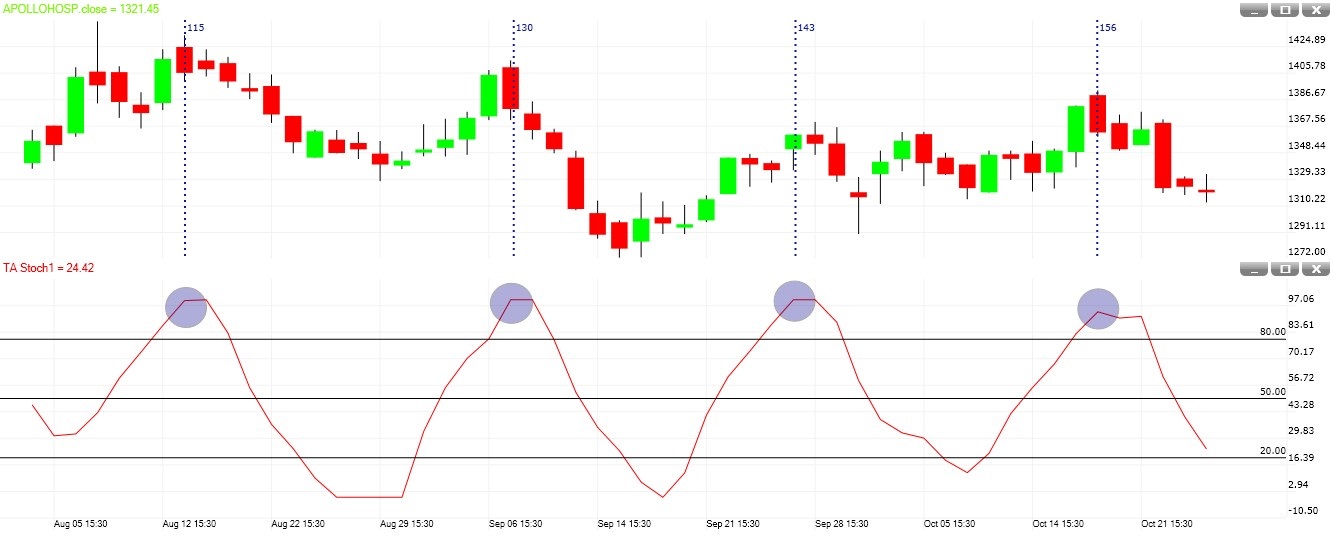
It is important to use this indicator always with the trend.
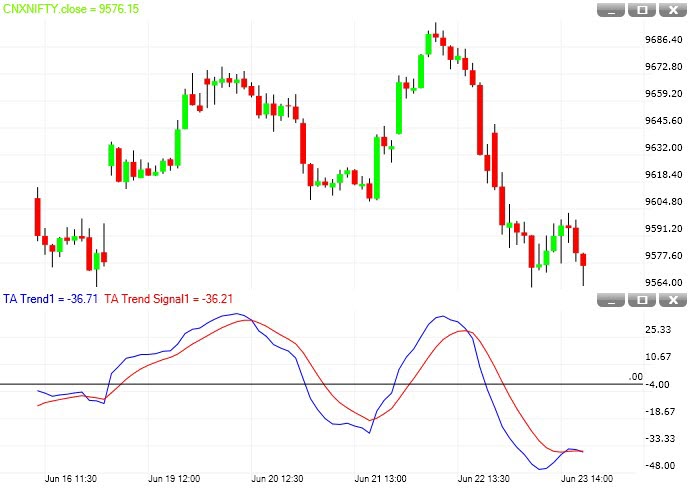
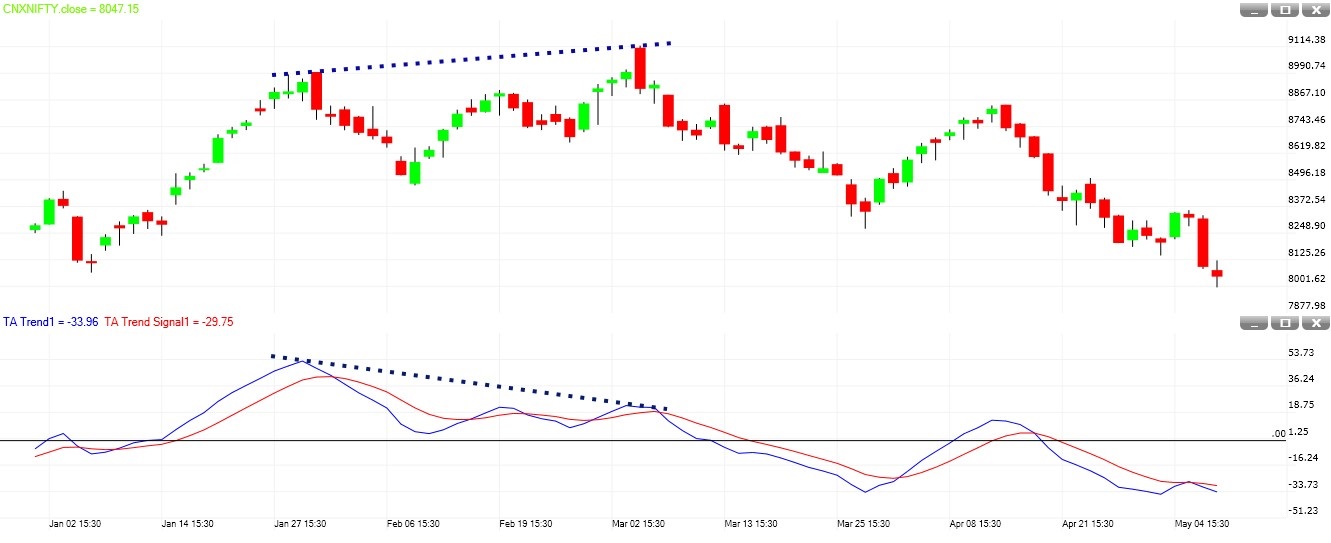
TA Trend indicator not only indicates the direction of the market as well as the amount of the movement of the market but also highlights market turning points. It is a sophisticated technical indicator that can help you identify shorter-term swings while staying in sync with the trend. TA Trend is applicable to both intraday time frames and longer-term horizons.
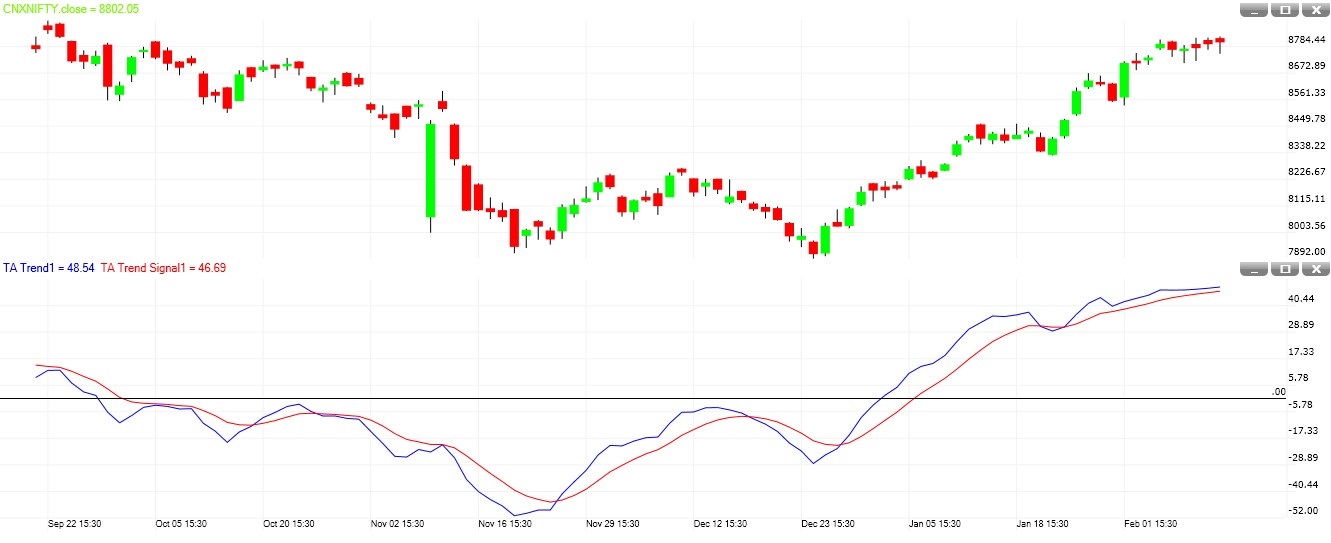
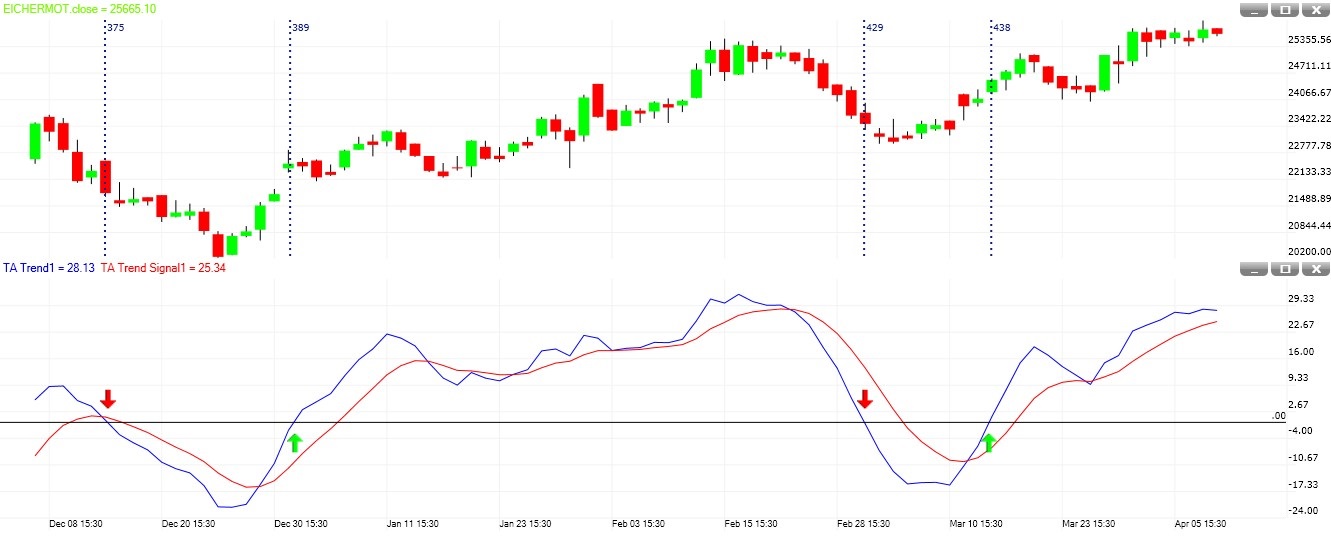
A bullish crossover occurs when the Blue Line turns up and crosses above the signal (Red) line. A bearish crossover occurs when the Blue Line turns down and crosses below the signal (Red) line.
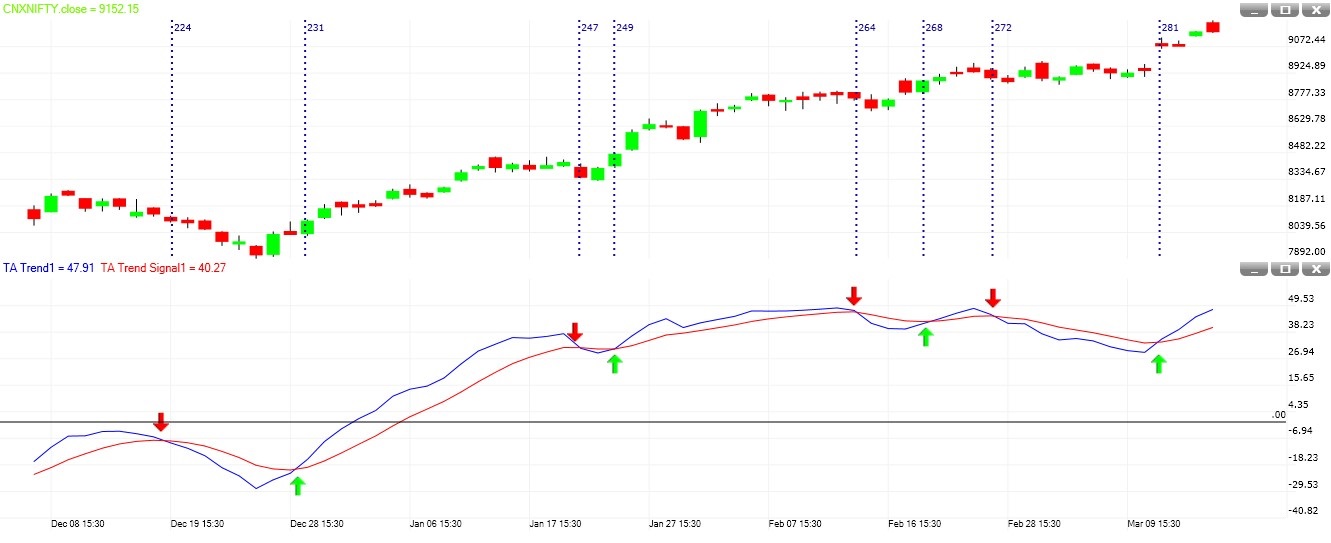
A bullish centerline crossover occurs when the Blue Line moves above the zero line to turn positive. A bearish centerline crossover occurs when the Blue Line moves below the zero line to turn negative.
Divergences form when the Blue Line diverges from the price action of the underlying security. A bullish divergence forms when a security records a lower low and the Blue Line forms a higher low. The lower low in the security affirms the current downtrend, but the higher low in the indicator shows less downside momentum.
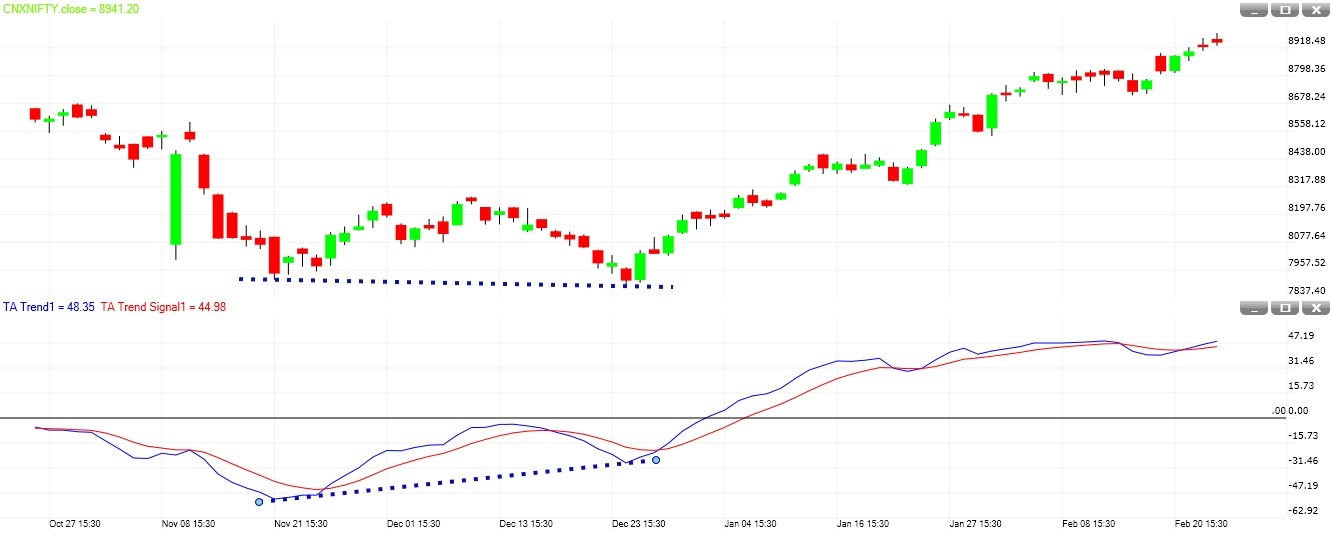
A bearish divergence forms when a security records a higher high and the Blue Line forms a lower high. The higher high in the security is normal for an uptrend, but the lower high in the indicator shows less upside momentum.
 Pay
Pay Sign Up