 Login
Login Sign Up
1. PURPOSE
As the markets are changing so it is wise to use that indicator which adapts quickly the market behaviour as they change. In search of this we have created this indicator.
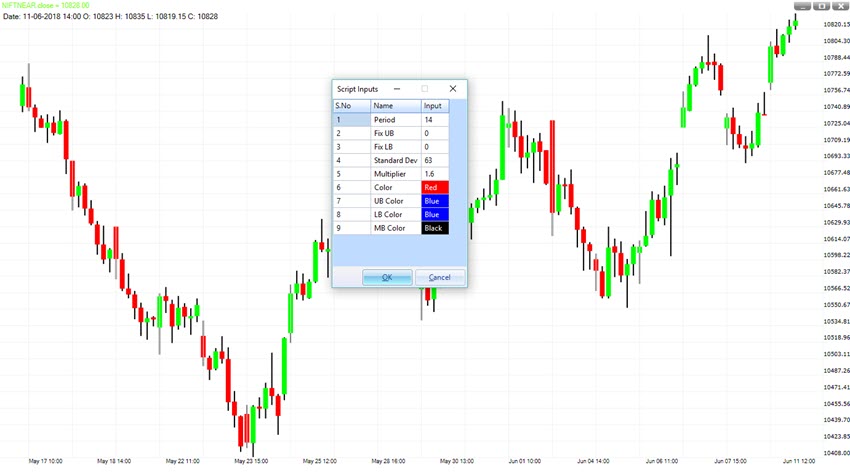
2. INPUTS
This indicator uses following inputs:
Period: Default value is 14. We can fiddle this value on the basis of time.
Suppose if you are looking for very short term trend then you can use a value 3 or 5. If you are looking for intermediate trend then you can use a value 11, 14 or 21. For a long term trend you can use 34 or 55.
FIX UB & FIX LB: This input is for the overbought and oversold levels. Putting a value above 0 will fix the overbought and oversold zone. Like any other oscillators, you can use 70 as overbought and 30 for oversold. We recommend you to use Default value ‘0’ for this input. This creates the overbought and oversold level adaptive according to price action.
Standard Dev: This value is for the BANDs Fluctuation. BANDS will be more smooth’s if you use a higher value. BANDs will be more fluctuating if you use a lower value. We recommend you to use Default value ‘63’ for this input.
Multiplier: This input helps to distinct the BANDs from middle line. Higher value will take BANDs far from mid line and lower value will take BANDs near the mid line. You can fiddle this value from 1 to 2 with one decimal. For example 1.1, 1.2,… 1.9 etc.
Color: This input help you to color the Oscillator lien, Bands and mid line.
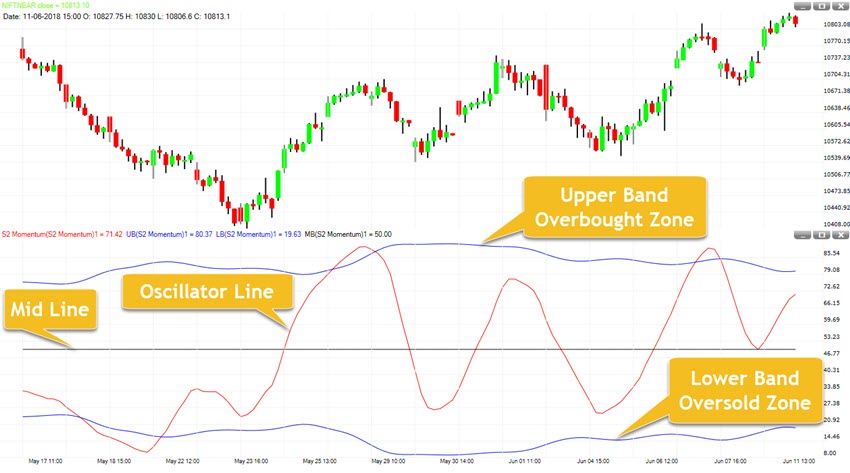
3. HOW TO INTERPRET
S2-Momentum is an advance oscillator with an adaptive level of overbought and oversold zone. If Oscillator Line (Red Line) is above the Upper Band, it means prices are overbought and will try to make a swing high there.
If Oscillator Line (Red Line) is below the Lower Band, it means prices are oversold and will try to make a swing low there.
An uptrend can be identified when Oscillator Line (Red Line) is moving up and above the lower band whereas a down trend can be identified when Oscillator Line (Red Line) is moving down and below the upper band.
4. OUTPUT
The oscillator has few unique properties which we should look after. These are;
- 1. Strong Uptrend: When prices cross above the lower band, moved higher and then turn down but never reach the lower band and keep moving above it.
- 2. Strong Downtrend: When prices cross below the upper band, moved lower and then turn up but never reach the upper band and keep moving below it.
- 3. Consolidation: When both Bands start narrowing and move towards the Mid Line.
- 4. Expansion: Narrow Bands start expanding and move away from the Mid Line.
- 5. Divergence: Gives an early warning for trend reversal.
EXCELLENT SIR JI..
please upload more example with chart how to work with s2 momentam.
thank you