 Login
Login Sign Up
1. PURPOSE
Parabolic SAR (PSAR) is a trend following indicator. A strategy with the help of the indicator helps you to ride the trend. It is very simple and most helpful in Day Trading.
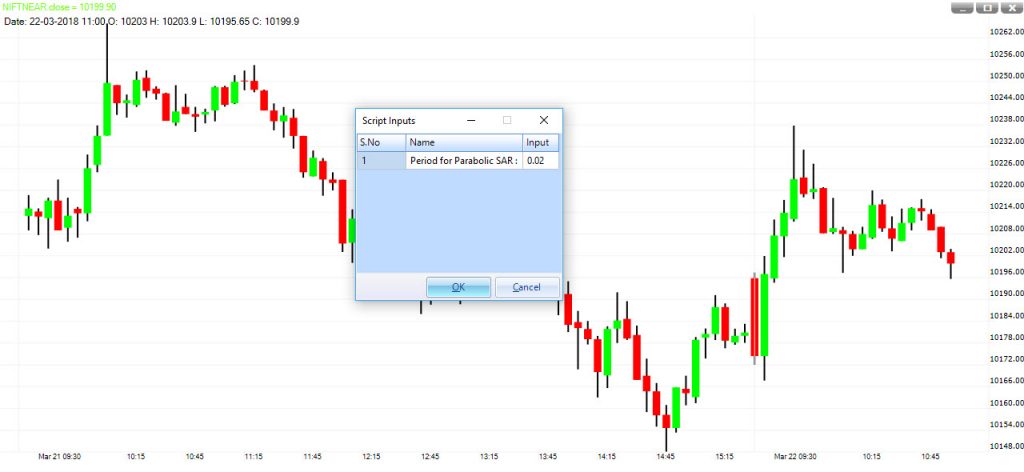
2. INPUT
The strategy has only one input called Period for Parabolic SAR. Default value is 0.02. Reducing this value may give more trade and whipsaws both. Increasing this value will give less trade but a deep stop.
3. HOW TO INTERPRET
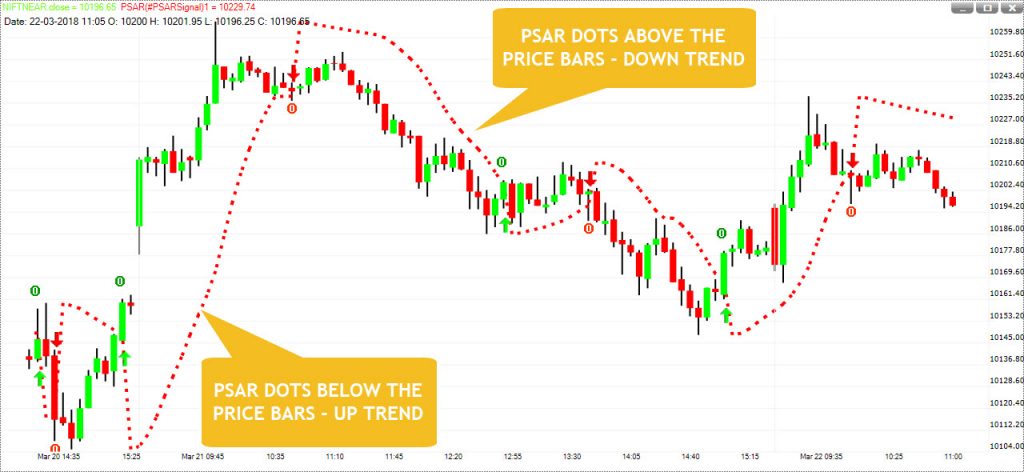
Parabolic SAR is plotted on the price chart of the stock as dots that appear above or below the candlesticks or bars.
During an uptrend, you will find that the Parabolic SAR dots appear below the price. On the other hand, when the price remains in a bearish trend, you will find that the Parabolic SAR dots appear above the price.
4. OUTPUT
The Parabolic SAR (PSAR) indicator is a great tool to have on your day trading chart. If you develop a proper Parabolic SAR strategy around some of its pitfalls, you can improve the accuracy of your existing trend following strategy.
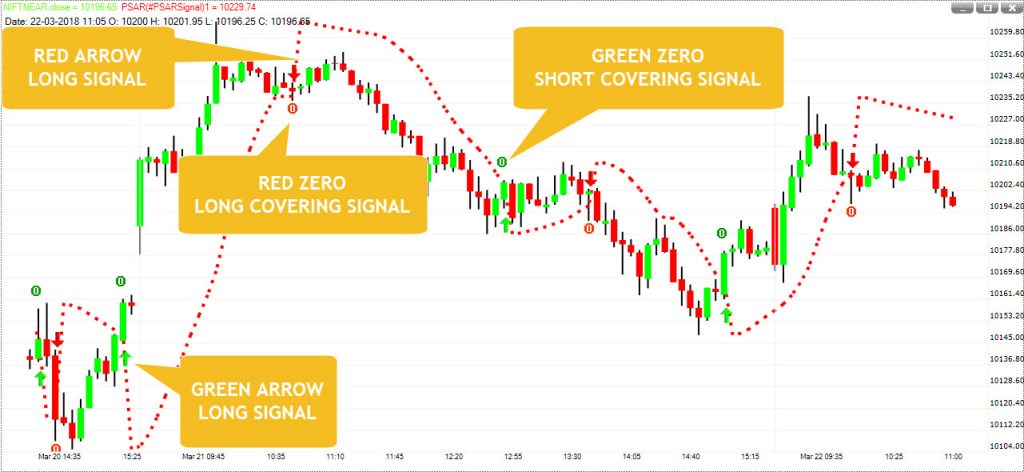
A green arrow (below the price bar) means a long position is taken here.
Red colour ZERO (0) below the price bar means the long position have closed here.
A red arrow (above the price bar) means a short position is taken here.
Green colour ZERO (0) above the price bar means the short position have closed here.
In addition, by using the Parabolic SAR dots as a trailing stop loss for your open positions, you can easily figure out when the trend is likely to reverse and protect your profits.
1 thought on “PSAR Signal”