 Login
Login Sign Up
1. PURPOSE
This query helps you to identify a potential high and low for a given periods.
2. INPUTS
We have given an option to scan the stocks where a high or low may be in place for an X number of Periods. For this purpose first you need to open a chart and then insert this query from the MENU SCRIPT.
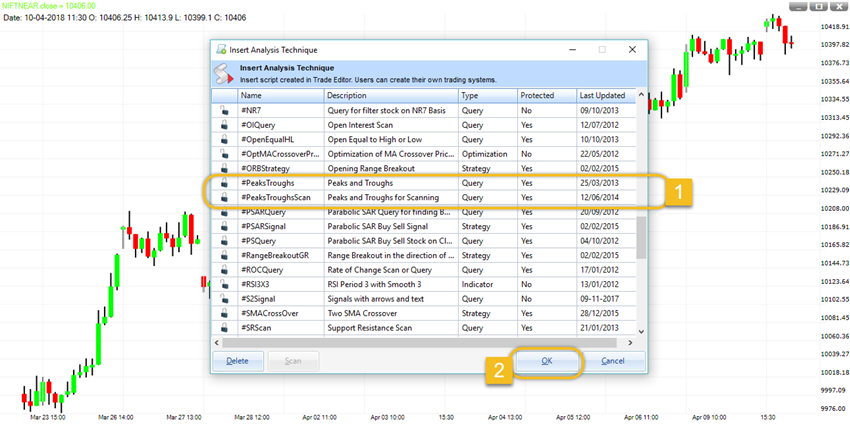
We have given two codes for this query.
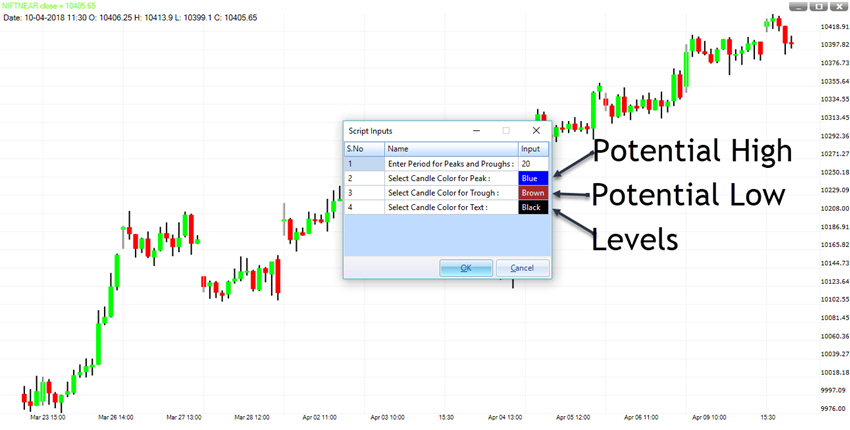
First is #PeaksTroughs. This code is designed to identify a potential high or low on the charts with the levels. There are four inputs for this query which you need to select.
- 1. Enter Period for Peaks and Troughs: Under this you need to choose the period. Default value is 20.
- 2. Select Candle Color for Peak: This input help to change the color of the bar where a potential high is in place. For example we have chosen BLUE color.
- 3. Select Candle Color for Troughs: This input help to change the color of the bar where a potential low is in place. For example we have chosen BROWN color.
- 4 Select Candle Color for Text: This input are for the color of the level weather it is high or low. For example we have chosen BLACK color.
Once you finish choosing the inputs click on OK. It will change the color of the bars where these conditions have met.
Second is #PeaksTroughsSCAN. This code is designed to get a list of the stocks where a potential high or low is in place. For this purpose first you need to open a chart and then insert this query from the MENU SCRIPT.
At the lower end of SCRIPT List Window you will find a tab named SCAN. Just click on that.
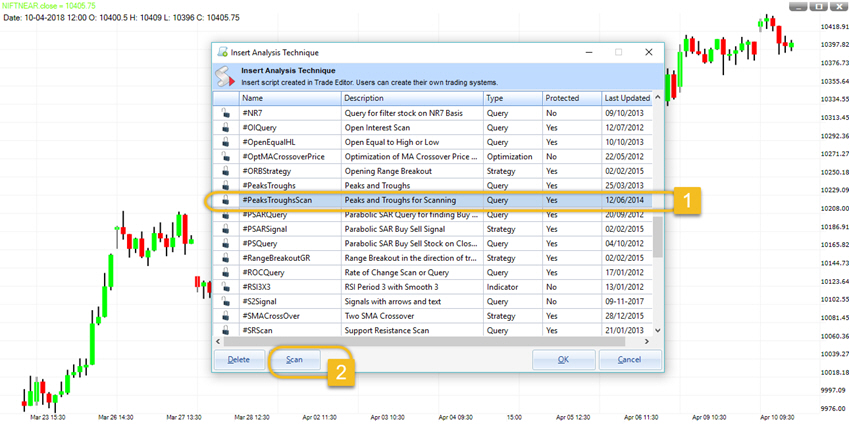
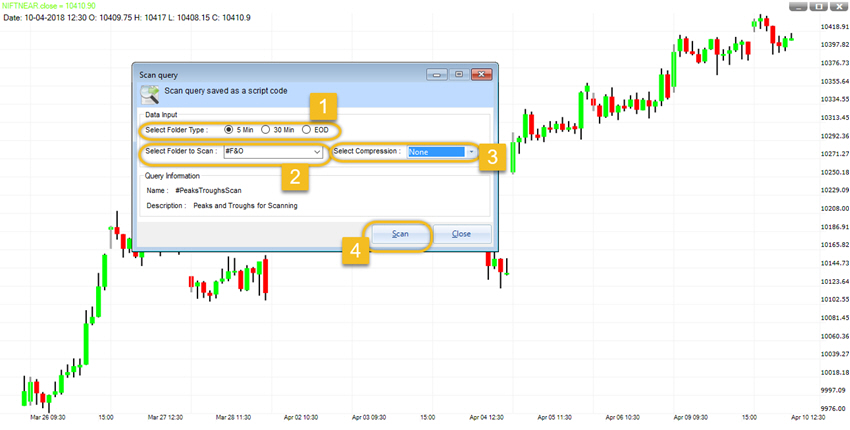
Once you click the scan tab a new window will appear in front of you. You need to fill the details here.
- 1. Select Folder Type: Under this you need to choose the timeframe. For example we have chosen the 5 Min timeframe.
- 2. Select Folder to scan: Choose the folder from the list where you want to scan the query. For example we have chosen the F&O Folder.
- 3. Select compression: We need to select the data compression here. For example we have selected none. For 5 Min data you can choose from 15, 30, or 60 Min timeframe.
- 4. Click on SCAN tab shown in the bottom of the window.
Once you click on the SCAN a new widow will appear in front of you.
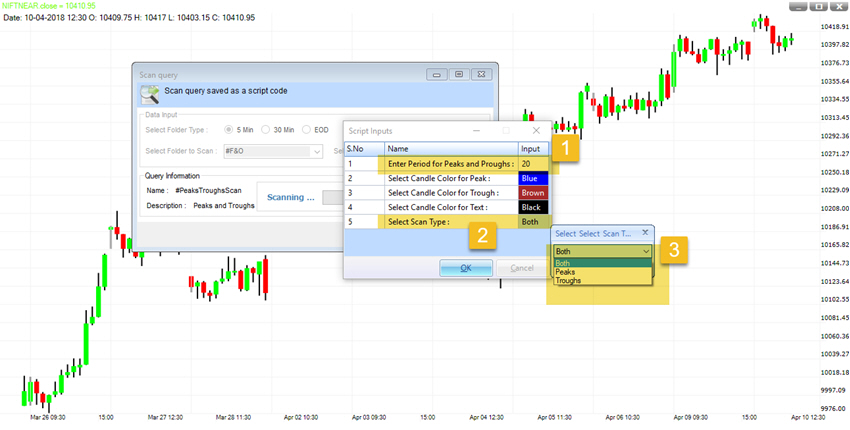
First you need to put a value of Period for Peaks and Troughs. For Example we have chosen 20.
Second you need to Select Scan Type. We have given three options BOTH, PEAKS and TROUGHS. You need to choose one from these three and then click on OK. For example we have chosen BOTH.
3. HOW TO INTERPRET
Peaks and troughs are patterns that are developed by the price action. Prices never move in straight lines, whether in an uptrend or a downtrend. There are minor swings within a large trend. If a trade can identify these swings on the chart then it will be very easy for them to take a trade in the direction of a trend. This query helps you to identify a potential high and low for a given periods.
We need to understand one thing that there potential high or low are now always right but still it will give us an edge or create an alert for us.
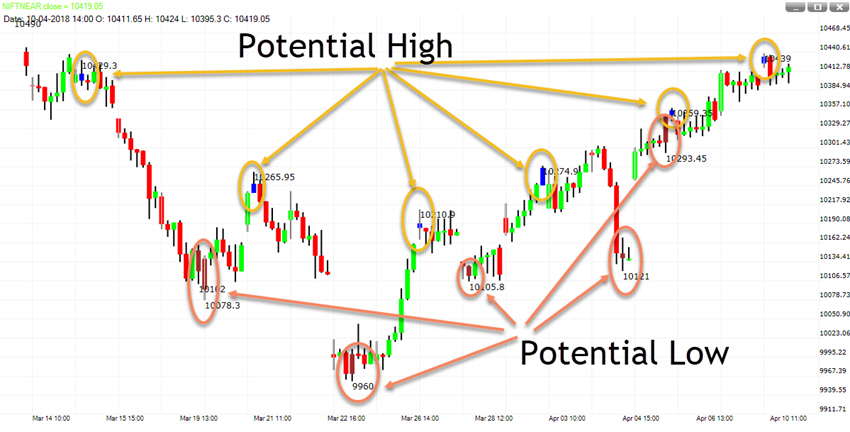
When you apply this query on the chart (by using the first code explained in the INPUT section) it will color the bars BLUE where a potential high is in place or BROWN where a potential low is in place. You can also see the levels on the chart.
4. OUTPUT
We can identify the trend on the chart by using the first code.
- 1. An uptrend can be identified by higher peaks.
- 2. A downtrend can be identified with lower troughs.
- 3. A sideways trend can be identified if the Peaks and Troughs are appearing near the same levels compare to previous peaks and troughs.
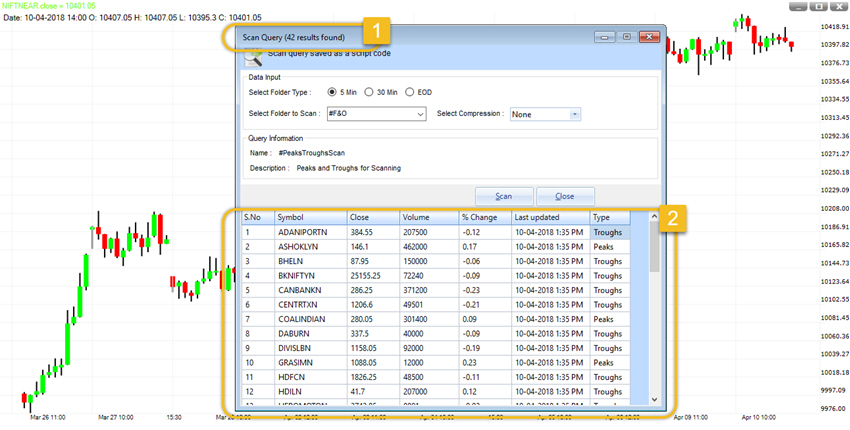
The second code (which we have scanned by using the second code explained in the INPUT section in) gives us a list of instrument from the folder we have selected to scan.
- 1. At the top of the window we can see that Scan Query found 42 stocks where our query “Both (Peak and Trough)” has met.
- 2. Below are the names of stocks with their last closing price and change in closing price compare to previous day. In the last column ‘Type’ you can see whether it is a Peak or Trough.
ON GOING THROUGH PEAKS TROUGHS, I FELL IT IS A GREAT TOOL BUT THE PROBLEM IS PEAKS OR TROUGHS FORMED TODAY ARE CHANGED NEXT DAY RETROSPECTIVELY WITHOUT ANY INFORMATION,
FOR EG. YESTERDAY 10/12/2018 TROUGHS WERE FORMED ON 6O MIN CHARTS ON NIFTY & BN , BUT TODAY THEY ARE NOT THERE & NEW TROUGHS HAVE BEEN FORMED ON 11/12/2018,
MY QUESTION TO U IS HOW DO I USE THEM IF THEY CHANGE RETROSPECTIVELY,
WAITING FOR YOUR REPLY
THX