 Login
Login Sign Up
Trend Days, Intraday
1. PURPOSE
Opening Range breakout (ORB) strategy is quite Simple and straightforward trading with an aim to find TREND DAYS.
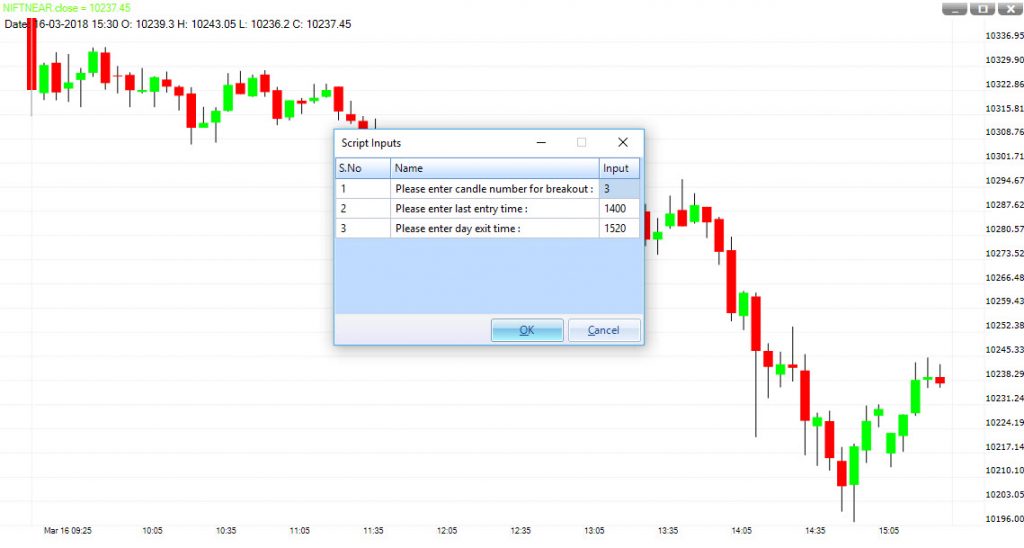
2. INPUT
The strategy should apply on 5 minute timeframe chart.
First input is number of bars. 1 bar is for 5 min so if you are looking for 15 minute range then you should enter 3 or if you are looking for 30 then you should enter 6 here.
Next option is last entry time. This is very helpful in restricting the unnecessary trades. We prefer 14:00 for last entry.
Third and the last option is exit time. We prefer 15:20 for exit time.
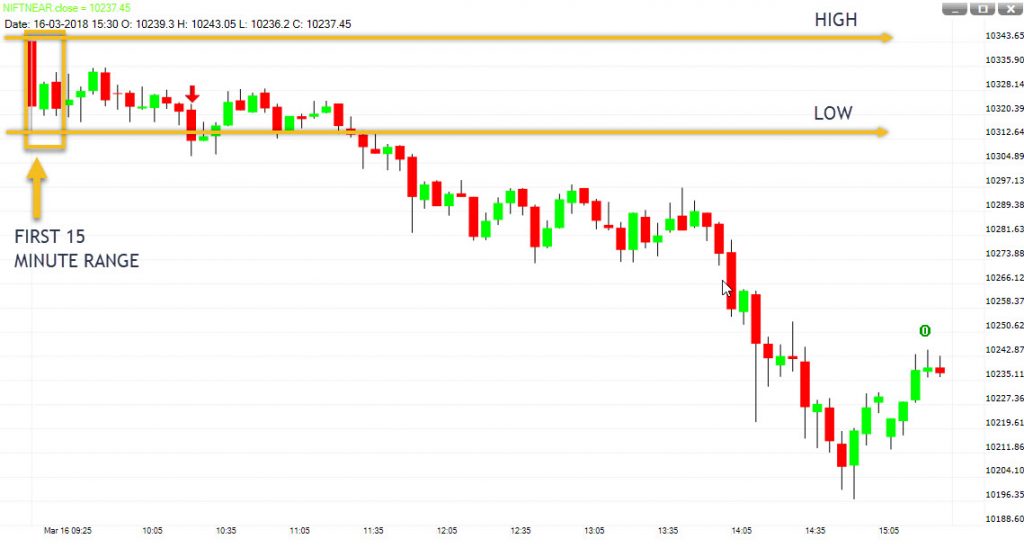
3. HOW TO INTERPRET
Any stock creates a range (high to low) in the first 15 or 30 minutes of trading in a day. This is calling Opening Range. The highs and lows of this time duration are taken as support and resistance.
Opening Range reveals the bias for the day. Few key points we should look before taking an ORB trade are;
- Good consolidation before the breakout
- A clean breakout
- High volume near the breakout level
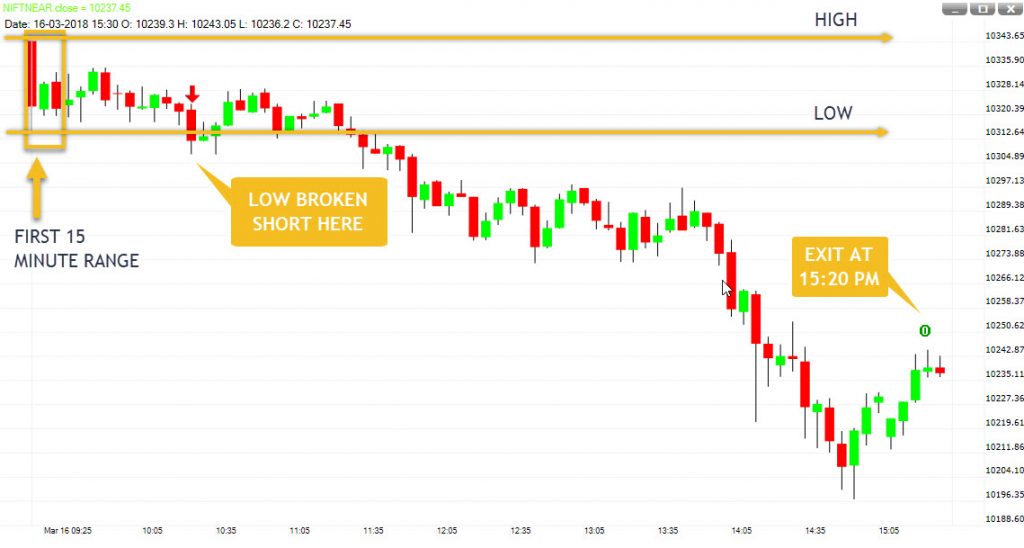
Trading rules are;
- Buy when the stock moves above the Opening Range High. Stop should be placed at Opening Range Low.
- Sell when the stock moves below the Opening Range Low. Stop should be placed at Opening Range High.
If stop does not hit till 15:20 PM then consider exiting at market price.
4. OUTPUT
A green arrow (below the price bar) will appear when Price crosses above the ORB HIGH. It means a long position is taken here.
Red colour ZERO (0) below the price bar means the long position have closed here.
A red arrow (above the price bar) will appear when Price crosses below the ORB LOW. It means a short position is taken here.
Green colour ZERO (0) above the price bar means the short position have closed here.
Which range 15M or 30M is best for intraday trading in case of BankNifty Fut? What if the range is huge in case of BankNifty Future? I am looking to take 30-50 pts profit.
Dear Sir
Thanks for the info. is this applicable to nifty also? How to estimate highs and lows post crossing orb other than close at 3.20?
If you know in good performing stock for ORB, Please inform.