 Login
Login Sign Up
After remaining in a trading range for 13 trading days, the Index is probably reaching a point where it will decide on its next direction, up or down. The 60 minute chart suggests a triangle for Nifty futures. This pattern forms the right shoulder for a larger head and shoulder pattern. Here is the chart:
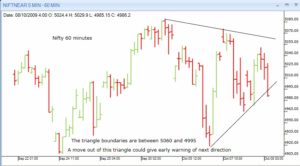
The final close today was below the lower line of the triangle. But, tomorrow is another day, therefore this close should be ignored and it should be assumed that the triangle is still open. We have infosys results coming in before the open, which are likely to influence the short term momentum. The upper boundaries of the triangle are at 5060 while the lower is at 4995. A move out of the triangle may offer an early indication of the direction for the Nifty.
How do you trade this? Wait for the market to open and the dust to settle. The 15 minute rule combined with these triangle levels could provide you with general guidelines for trading, tomorrow.
ITC touched 253, its target for a breakout, referred a few days ago. Quite often technical targets are touched smoothly, without much effort. Sometimes, they fail. This is what trading is about – probability.
Shazia asks: “Can a short term (60 minute) chart be used to determine longer term trend?”
My Notes: I always thought the opposite was true, meaning the longer term trend could be used to determine the direction in which short term trades (say on 60 minute chart) may be taken. The 60 minute chart may be used to determine long term trend by using a surrogate trend. For example, if you use a 20 day moving average to identify the trend on a daily chart, you could then apply a 120 period average to the 60 minute chart and get roughly the same trend.
Hemanta Gogoi says “It also looks like an probable inverted HS when seen upside down. Please shed some light on this. ”
My Notes: When I read this comment, I thought the chart also showed an inverted H&S and spent some time trying to find it. It is possible that a chart may have more than one pattern. Now that I read the comment again, Hemanta is writing about the chart when seen upside down. Yes, of course, when you rotate the chart, a head and shoulder pattern becomes an inverted H&S, and vice versa.
nice analysis sir