 Login
Login Sign Up
Trend Trading, Two Moving Averages
1. PURPOSE
Most Traders assume the “Trend is your Friend” and trade with the main trend of the chart. So how can we determine the direction of the trend? This strategy helps to you to do so.
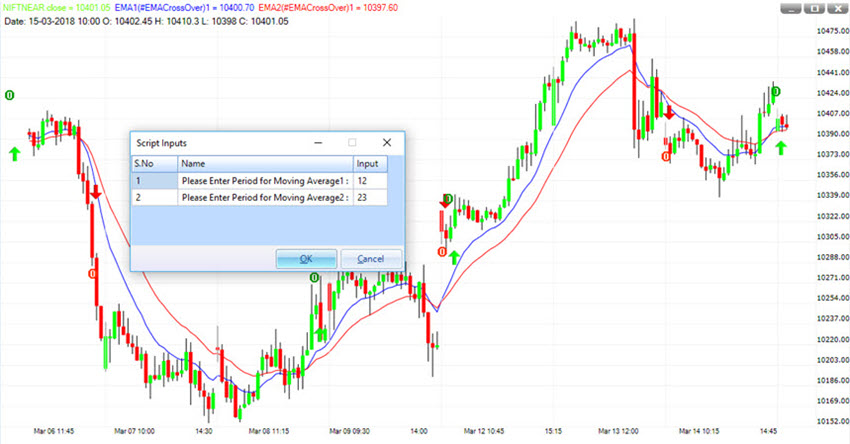
2. INPUTS
This strategy uses two Exponential Moving Averages (EMAs). First one is shorter period and second one is longer period. The strategy does not allow you to change the MA Type. However you can change the EMA value.
3. HOW TO INTERPRET
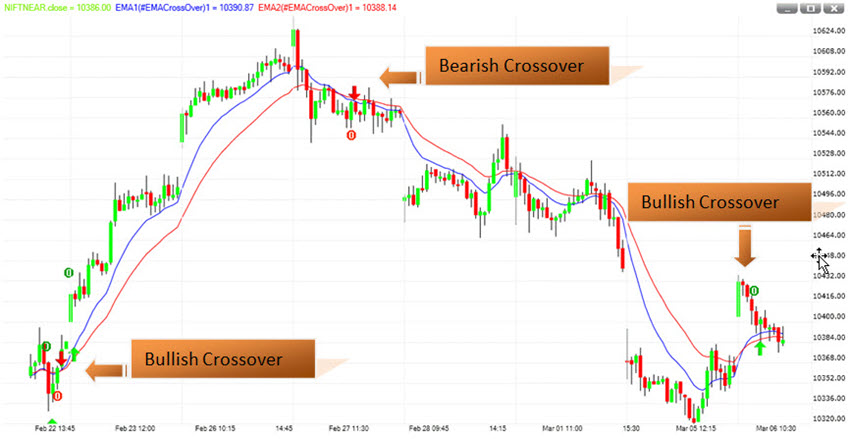
Moving average crossovers are a common way traders can use Moving Averages.
A bullish crossover occurs when the shorter moving average crosses above the longer moving average. This is also known as a golden cross.
A bearish crossover occurs when the shorter moving average crosses below the longer moving average. This is known as a dead cross.
These signals work great when a good trend takes hold. However, a moving average crossover system will produce lots of whipsaws in the absence of a strong trend.
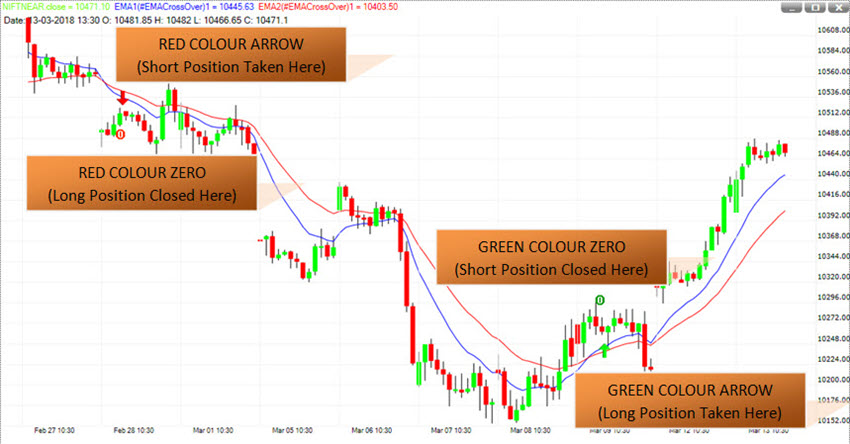
Blue Line is the faster Moving Average (i.e. a shorter period Moving Average) while Red Line is the slower Moving Average (i.e. a longer period Moving Average).
A green arrow (below the price bar) will appear when Blue Line crosses above the Red Line. It means a long position is taken here.
Red colour ZERO (0) below the price bar means the long position have closed here.
A red arrow (above the price bar) will appear when Blue Line crosses below the Red Line. It means a short position is taken here.
Green colour ZERO (0) above the price bar means the short position have closed here.
Great