 Login
Login Sign Up
Introduction:
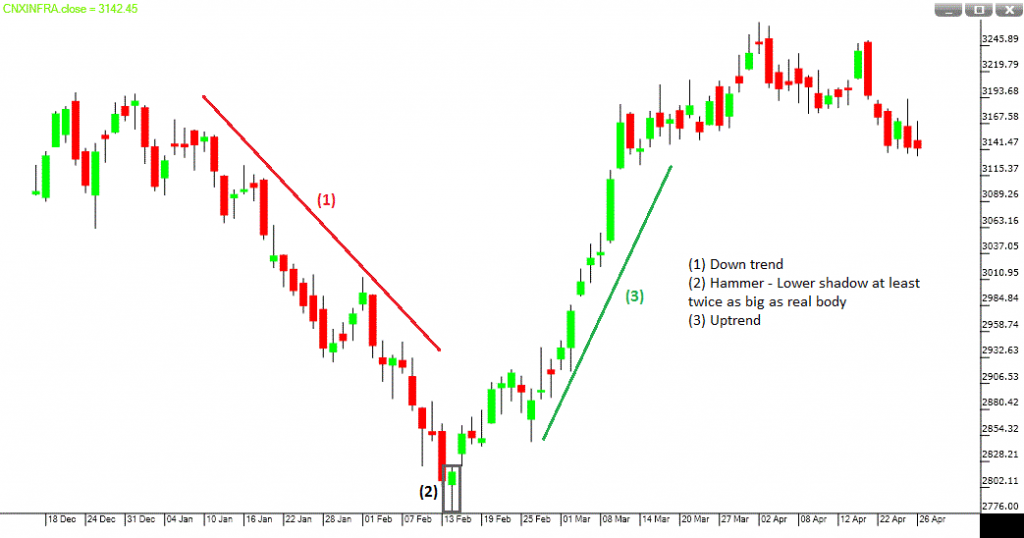
This pattern consists of a single candle. It is considered as a reversal pattern. It occurs at bottom of the down trend (bear).
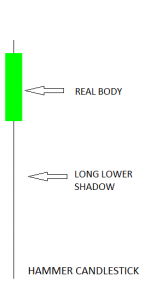
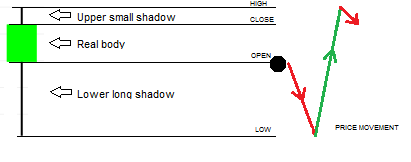
The hammer candle consists of small real body and large lower shadow. The shadow part should be much longer more than twice of real body. The real body part shows the difference between the open and the close price while shadow represents high and low of the candle.
Concept:
Large lower shadow tells us at some point buyer came at the lower levels, took control and push prices higher. In other words, a long lower shadow represents a period of trading where the seller is initially in control but the buyers are able to reverse that control. No/small upper shadow suggests bears are losing their control. A small real body suggests the action area between bulls and bears are very narrow and a reversal may in offering.
Interpretation:
It is a reversal pattern so we need to treat it in the same way. This pattern suggests a low may be in place, so if prices break the low then this pattern gets cancelled. Also a confirmation is required after the Hammer Candle. Hammers are most effective when they are preceded by at least three or more red candles or in other words, market would open lower compared to the previous day’s close and again closes lower.
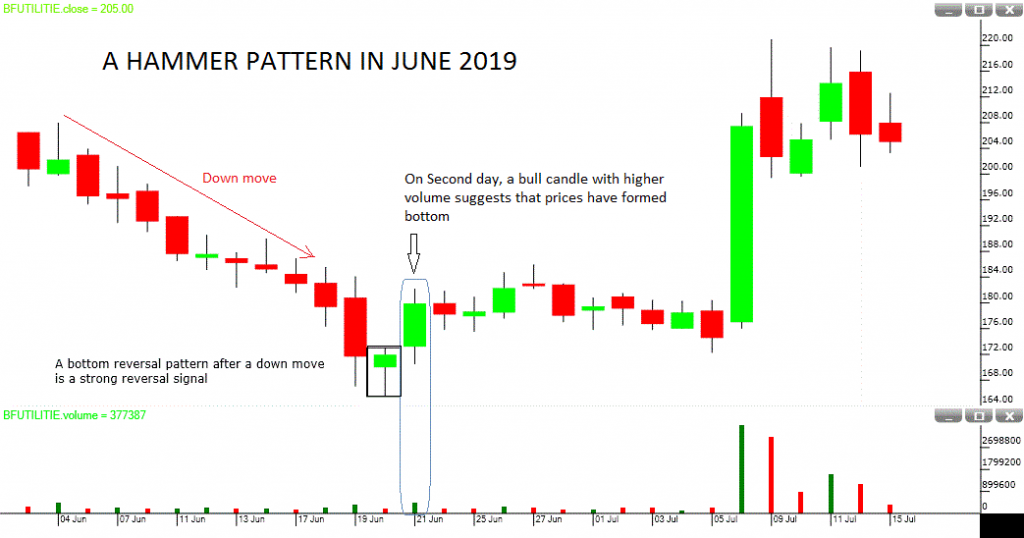
A confirmation would be a higher open price with higher volume and closed above on the next trading day. The body color of the candle adds the significant of the trend predicatively. Green body would be more bullish. The hammer is an extremely helpful candlestick pattern to help traders visually see where support and demand is located.
Trade set up:
- The hammer candle suggests a long trade.
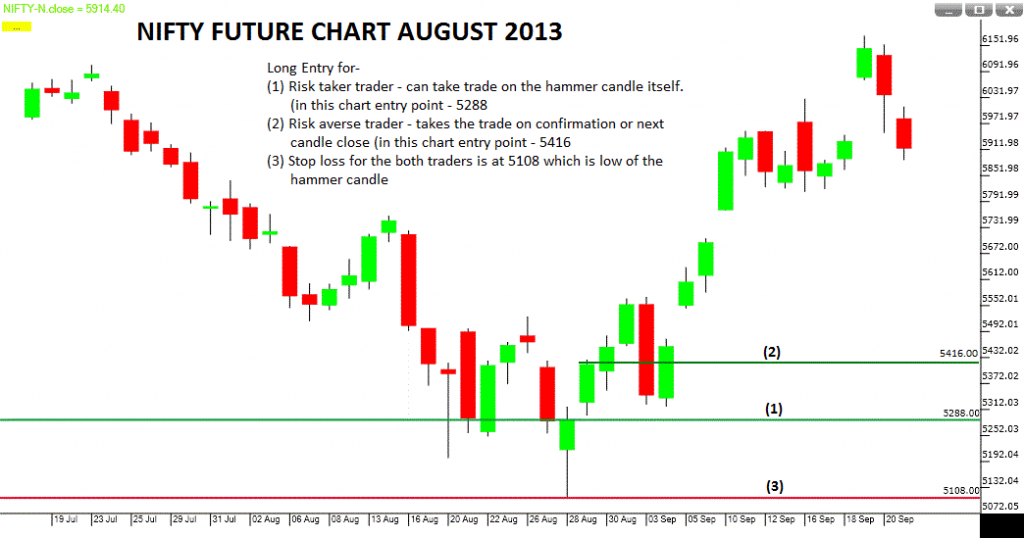
- The entry point depends on the risk appetite of the trader.
- Risky trader can take trade on the hammer candle itself.
- For risk averse takes the trade on the confirmation or next candle close.
Points to remember:
- A hammer occurs after a security has been declining, suggesting the market is attempting to determine a bottom.
- There is no assurance the price will continue to move to the upside following the confirmation candle.
- Hammers also don’t provide a price target, so figuring what the reward potential for a hammer trade is can be difficult.
1 thought on “Candlestick Patterns: Hammer”