 Login
Login Sign Up
1. PURPOSE
This query helps you to identify those stocks which are trading higher or lower to their past price for a set number of periods.
2. INPUTS
We have given an option to scan the stocks where prices have closed higher or lower for an X number of Periods. For this purpose first you need to open a chart and then insert this query from the MENU SCRIPT.
At the lower end of SCRIPT List Window you will find a tab named SCAN. Just click on that.
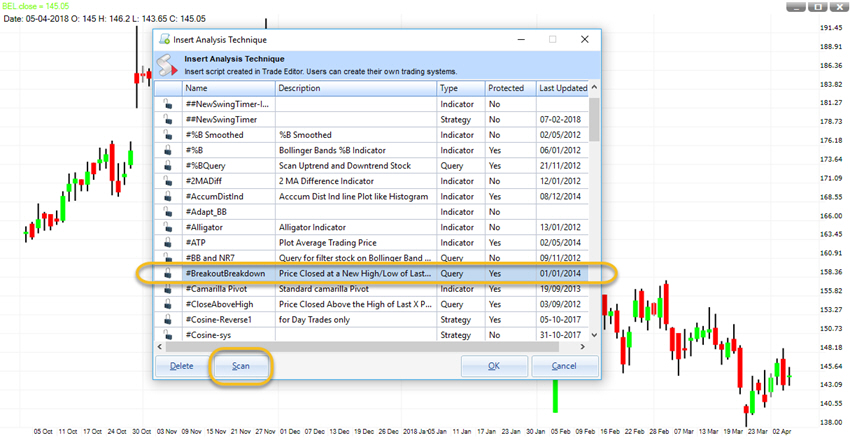
Once you click the scan tab a new window will appear in front of you. You need to fill the details here.
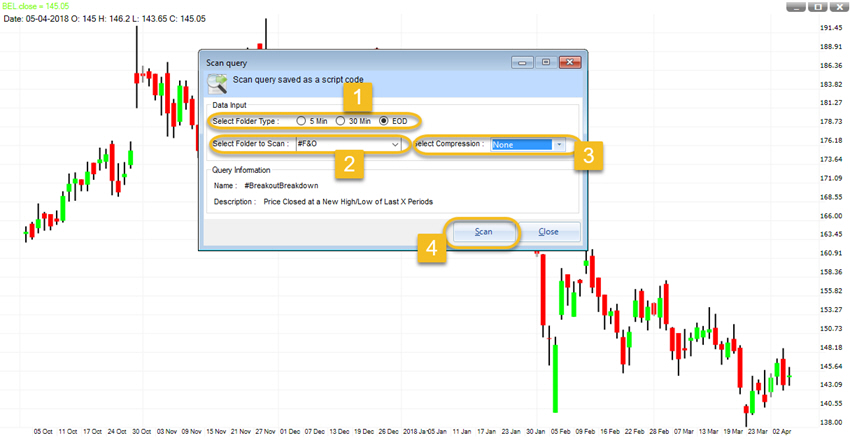
- 1. Select Folder Type: Under this you need to choose the timeframe. For example we have chosen the EOD timeframe.
- 2. Select Folder to scan: Choose the folder from the list where you want to scan the query. For example we have chosen the F&O folder.
- 3. Select compression: We need to select the data compression here. For example we have selected none. For EOD data you can choose from weekly or monthly timeframe.
- 4. Click on SCAN tab shown in the bottom of the window.
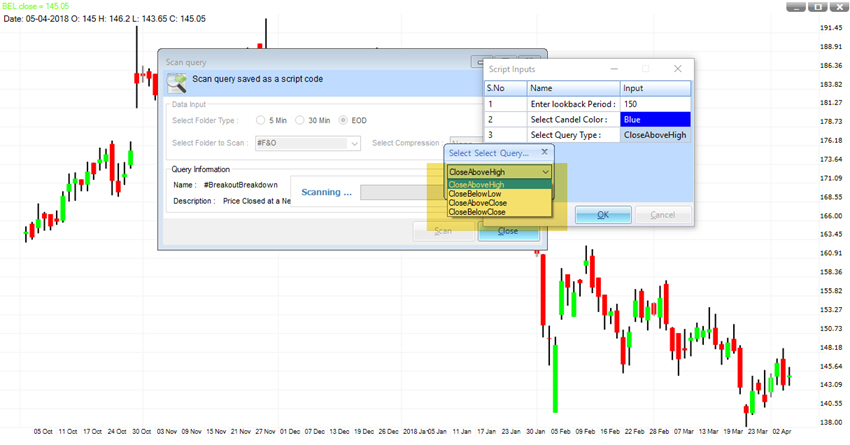
Once you click on the SCAN a new widow will appear in front of you. First you need to put a value of lookback period. For Example we have chosen 150.
- 1. Close Above High: Current closing price is higher than last 150 days Higher price.
- 2. Close Below Low: Current closing price is lower than last 150 days Lower price.
- 3. Close Above Close: Current closing price is higher than last 150 days Closing price.
- 4. Close Below Close: Current closing price is lower than last 150 days Closing price.
Select whichever you want to scan and then click on OK. For Example we have chosen the Query “Close Above High.”
3. HOW TO INTERPRET
A stock’s market price is nothing but an indication of what major participants perceive its value to be. The rationale behind this query is that if prices are higher or lower than the last X number of period then there is enough momentum to continue the price move in a favourable direction.
An expected up move can be derived by
- 1. Close Above High: Current closing price is higher than last X days Higher price.
- 2. Close Above Close: Current closing price is higher than last X days Closing price.
An expected down move can be derived by
- 1. Close Below Low: Current closing price is lower than last X days Lower price.
- 2. Close Below Close: Current closing price is lower than last X days Closing price.
4. OUTPUT
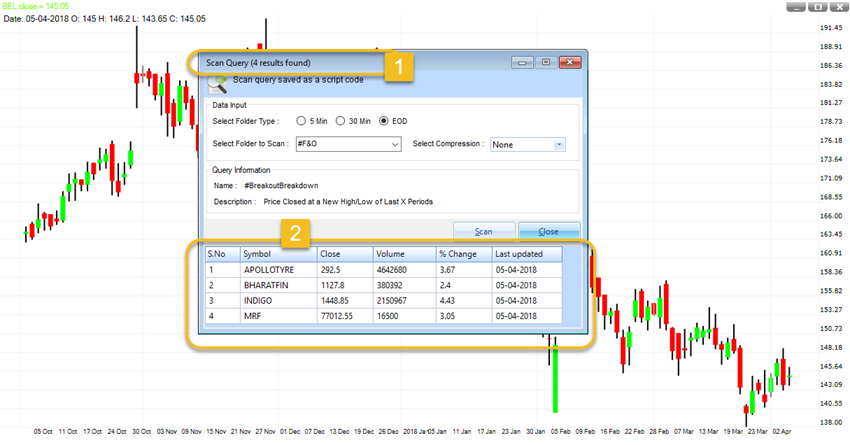
This query gives us a list of instrument from the folder we have selected to scan.
- 1. At the top of the window we can see that Scan Query found 4 stocks where our query “Close Above High” has met.
- 2. Below are the name of stocks in which current closing price is higher than the last 150 periods higher price with their last closing price and change in closing price compare to previous day.
1 thought on “Breakout Breakdown”