 Login
Login Sign Up
1. PURPOSE
Prices moves in a trend weather it’s up or down or sideways. This query helps you to identify the underlying trend in a stock.
2. INPUTS
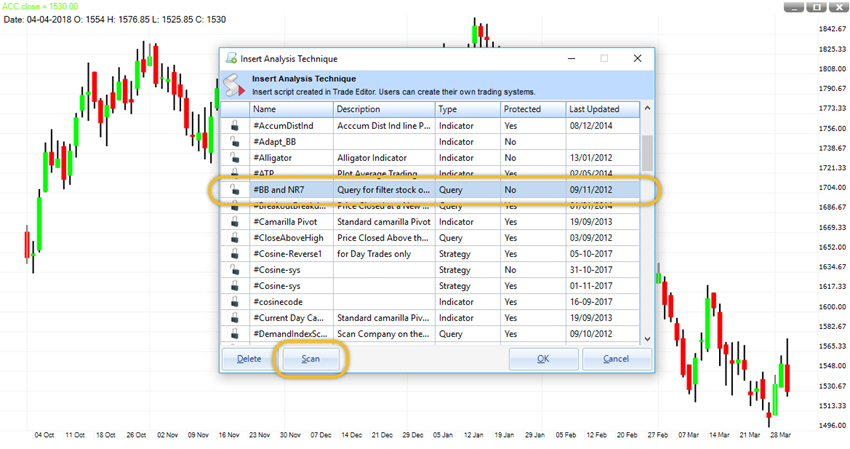
First you need to open a chart and then insert this query from the MENU SCRIPT.
At the lower end of SCRIPT List Window you will find a tab named SCAN. Just click on that.
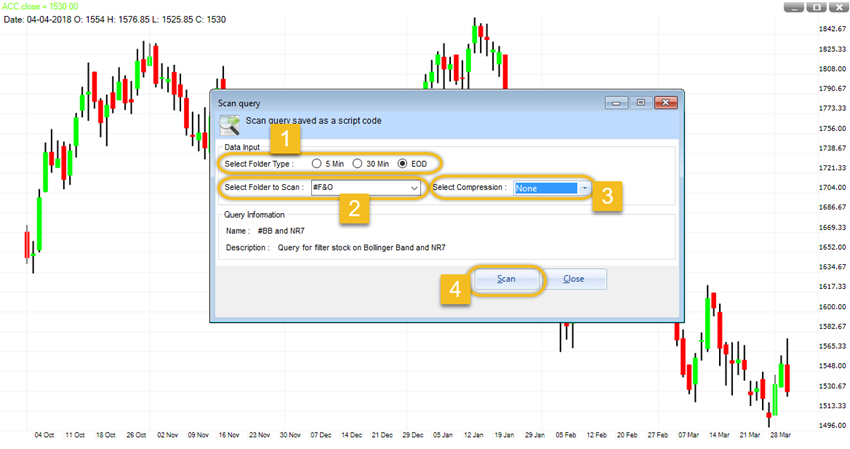
Once you click the scan tab a new window will appear in front of you. You need to fill the details here.
- 1. Select Folder Type: Under this you need to choose the timeframe. For example we have chosen the EOD timeframe.
- 2. Select Folder to scan: Choose the folder from the list where you want to scan the query. For example we have chosen the F&O folder.
- 3. Select compression: We need to select the data compression here. For example we have selected none. For EOD data you can choose from weekly or monthly timeframe.
- Click on SCAN tab shown in the bottom of the window.
Once you click on the SCAN a new widow will appear in front of you.
- 1. Close Below Lower Bollinger Band: To identify a downtrend.
- 2. Close Above Lower Bollinger Band: To identify an uptrend.
- 3. Consecutive NR7: To identify a sideways trend.
Select whichever you want to scan and then click on OK. For Example we have chosen the Query “Close Below Lower Bollinger Band.”

3. HOW TO INTERPRET
NR7: It is a term given to a day that has a range smallest of last 7 trading days including that day. Market goes through regular contraction and expansion cycle. Expanding range is followed by Contraction and vice-versa. So if we can identify the narrow range days, then it give us a step ahead to benefit from coming expansion. NR7 represents contraction and warn us that a range expansion may come. However the direction is unknown but we can assume that the large expansion may come in the direction of the trend.
BOLLINGER BANDS: Bollinger Bands reflect direction with the SMA and volatility with the upper/lower bands. As such, they can be used to determine if prices are relatively high or low. A move outside the bands is very significant. Technically, prices are relatively high when above the upper band and relatively low when below the lower band.
4. OUTPUT
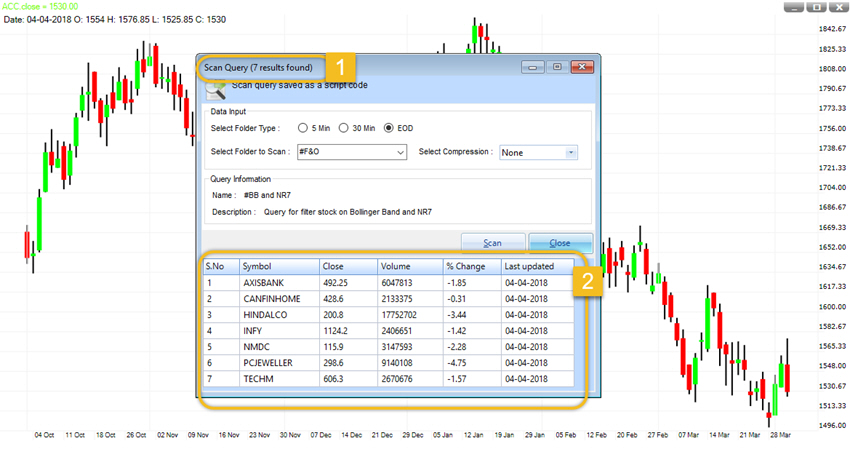
This query gives us a list of instrument from the folder we have selected to scan.
- At the top of the window we can see that Scan Query found 7 stocks where prices have closed below the lower band.
- Below are the names of stocks where prices have closed below the lower band with their last closing price and change in closing price compare to previous day.
1 thought on “BB and NR7”