 Login
Login Sign Up
1. PURPOSE
The Accumulation Distribution Line can be used to gauge the general flow of volume, affirm a security’s underlying trend or anticipate reversals when the indicator diverges from the security price.
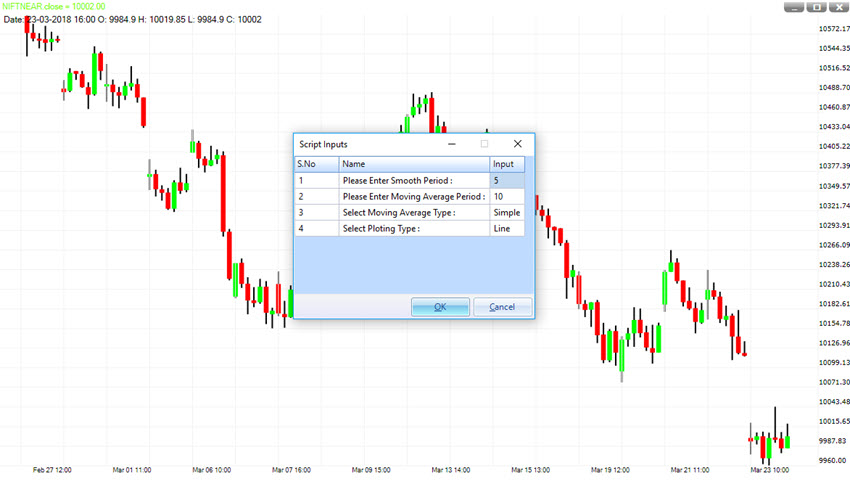
2. INPUTS
This indicator uses four inputs:
Smooth Period: As the indicator line is very fluctuating in nature so we use this input to get a clear sense of direction.
Moving Average Period: We have given an option to create the MA line for the indicator. This line can be used to get more confirmation.
Moving Average Type: Traders can choose from SMA, EMA, and ZMA etc. for the MA Line.
Plotting Type: This input helps you change the visual of indicator from line to histogram or dash or dash dot.
3. HOW TO INTERPRET
The Accumulation Distribution Line is a volume-based indicator designed to measure the cumulative flow of money into and out of a security.
The Accumulation Distribution Line is a cumulative measure of each period’s volume flow, or money flow.
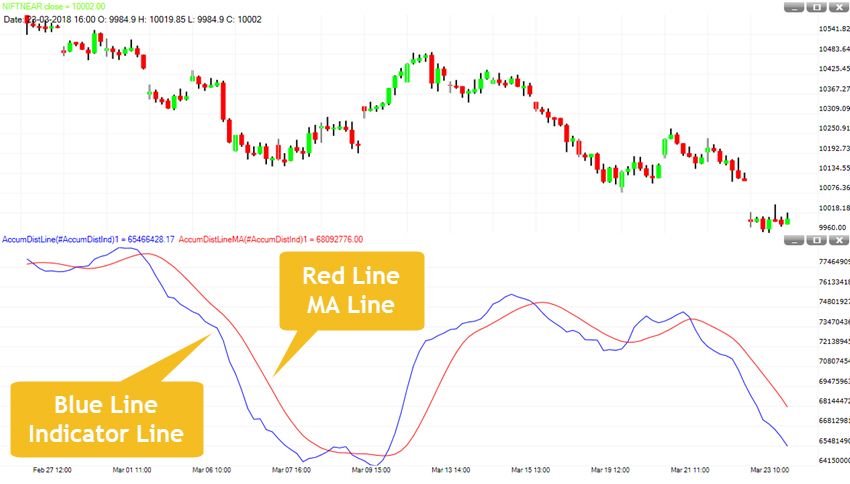
Blue Line is the indicator line while Red Line is the MA Line.
An uptrend can be identified when both lines are moving up whereas a down trend can be identified when both lines are moving down.
4. OUTPUT
Rising line with rising volume shows strong buying pressure. Falling line with falling volume shows strong selling pressure.
An uptrend in prices with a downtrend in the Accumulation Distribution Line suggests underlying selling pressure (distribution) that could foreshadow a bearish reversal on the price chart.
A downtrend in prices with an uptrend in the Accumulation Distribution Line indicate underlying buying pressure (accumulation) that could foreshadow a bullish reversal in prices chart.