 Login
Login Sign Up
Robert Shiller is one of America’s finest acadamicians in the field of economic reserach. Here is a chart picked up from data collected by Shiller on PE ratios and their impact on market performance.
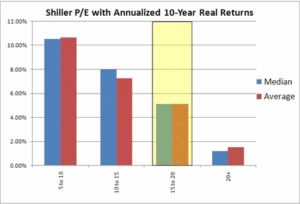
The chart tells us: Over a 10 year period, stocks with low PE have outperformed stocks with high PE> This is common sense, but investors will often forget this. Stocks with a PE between 5 and 10 have given the best returns, while those above 20 PE have given the worst.
((http://www.mebanefaber.com/2010/06/09/shiller-pe-ratios-and-10yr-annualized-real-returns/)