Login
Login Sign Up
Our reader wants to know how to plot the LBR RSI in Trend Analyzer. This is easy to do. Since the concept was interesting, I am discussing it in the blog.
What is the LBR RSI?
This is used in a method called ‘Momentum Pinball’ discussed in the Raschke and Connors book, Streetsmarts. The method calculates a 3 period RSI of a one day ROC. When the RSI falls below 30 in an end of day chart, a buy signal is triggered. Buying is done the next day when the first hour high is crossed. A sell signal is triggered when the RSI goes above 70. Again, actual selling is done below the low of the first hour, the next day.
How to calculate this in Trend Analyzer?
1. Insert Indicator: Rate of Change
2. Values: Period1 = 1, Period2 = 1, Extreme High = 70, Mid Point = 50, Extreme Low = 30
3. Click on Advanced: click on RSI and change period to 3.
4. In the visibility option, you may like to turn off the mid point which is 50, because that is not used.
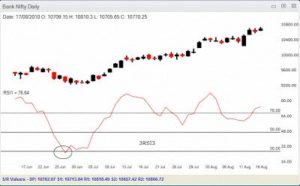
Here is a chart of the Bank Nifty with the Indicator:
Like most setups, this is is best used in the direction of the trend. This is my thought, not from the book. But going with the trend is usually the most sensible way to trade.
Another option is to use 3RSI3, which is the 3 period simple MA of a 3 period RSI. (In Trend Analyser this is easy to create. Insert the RSI indicator, Period=3, Smooth=3. Change the Extreme High and Extreme low to 70 and 30.
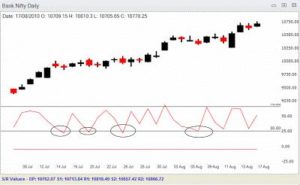
Here is the BankNifty chart with this indicator: