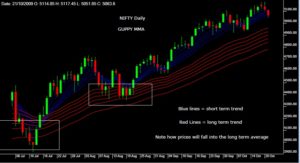
The Guppy MMA is a set of moving averages created by Daryl Guppy. [Please do a web search to get more information about him and the MMA]
Briefly, there are two sets of averages, blue and red. When both the sets are moving up, the trend is up. At periodic intervals, the blue (short term) will dip into the red where it finds support. So far as the support holds, the trend is UP.
I am giving the daily chart for the Nifty with both the averages. What I understand is this:
1. The red lines are pointing up, trend is up.
2. A dip into the red set is due. The blue lines are contracting.
3. When the red lines are widespread , there is a strong trend. This is the case now.
Comments are welcome.


