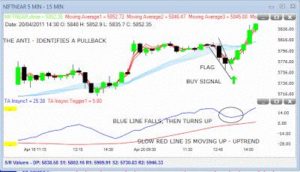
The Anti is a price/indicator setup popularised by Linda Raschke and Larry Connors in their book, Streetsmarts. The pattern dentifies a small pullback after an impulse, trending move. The pullback may look like a bull/bear flag on the price chart, OR it may repersent a pullback in an indicator. The Anti can be identified in indicator which use two lines – fast and slow. The slow line should be used to identify the trend direction. The fast line moves against this trend. When the fast line turns back in the same direction as the slow line, the Anti is confirmed.
At least for Technical Analysis, a picture is worth a thousand words. So here is a chart showing the Anti.


