Trend Trading, Very simple to use
1. PURPOSE
Supertrend indicator is a combination of momentum and volatility. This indicator helps you to ride the trend once it established.
2. INPUTS
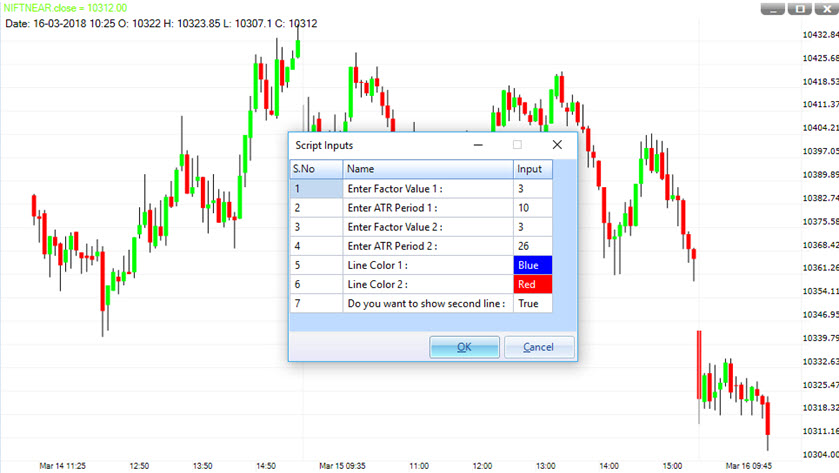
Supertrend indicator uses two parameters, namely ATR and Factor (multiplier). We have given users an option to create two indicator lines on a single chart.
ENTER FACTOR VALUE 1 and ENTER ATR PERIOD 1 is for the first line whereas ENTER FACTOR VALUE 2 and ENTER ATR PERIOD 2 is for the second line. Use can change the color of each line and we have also given an option to show the second line or not.
The average true range (ATR) plays an important role in ‘Supertrend’ as the indicator uses ATR to calculate its value. The ATR indicator signals the degree of price volatility.

3. HOW TO INTERPRET
The indicator is easy to use and gives an accurate reading about an ongoing trend.
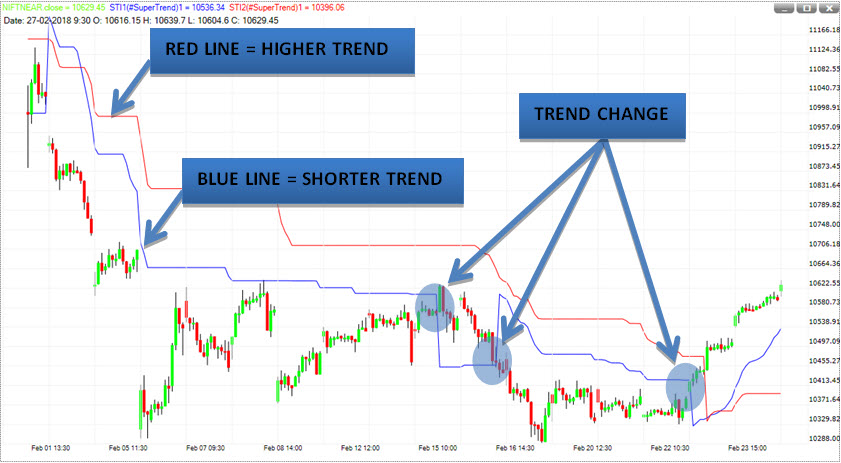
If the line is close above the price then trend is down and if line is close below the price bar then the trend is up.
As we have an option to apply two lines so we should look red line as a higher trend and blue line as a shorter trend.

A ‘Supertrend’ indicator can be used on daily, weekly and hourly charts, but generally, it fails in a sideways-moving market.
This indicator works very well in a trending market.
This indicator also acts as a strong support or resistance and it also provides a trailing stop loss for the existing trade.
In a ‘buy’ signal, any dip towards the indicator can also be used as a buying opportunity and vice versa.
It is precise and easy to use as explained above. It is fast so quick trading decisions can be made for intraday traders.

