Login
Login Sign Up
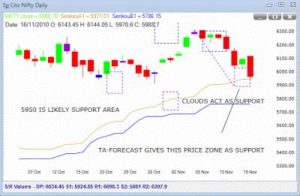
There was a reference to Clouds in one of the comments. Since I use Ichimoku lines, I thought I will offer a chart with Ichimoku clouds. Here is the Nifty end of day chart with (a) Ichimku clouds, and, (b) TA-Forecast. The clouds are an excellent trading method. Information on them is available on Google. TA-Forecast is a proprietory method which provides forecasts of support or resistance zones in the future. It is a predicitve indicator. Both, the clouds and the TA_Forecast suggest there is support in the 5950 area. But, the last word always ermains with the market.
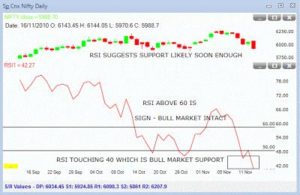
Saurabh wanted the Nifty analyzed with indicators. Well, here is the Nifty with the 14 day RSI. Comments are given on the chart itself.