 Login
Login Sign Up
Once in a while, it is always preferred to have a look at one such chart, that developed certain patterns on charts, and reacted to it, making worthwhile positional trades. One such chart at the moment is that of Reliance Capital. Let’s a look:
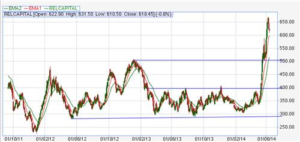
After falling from 500 to 300 in the first half of 2013, and then going sideways in a trading range, it also made a triple bottom at around 300 and finally broke out of it. Just observe the speed with which the target of the pattern of 500 was achieved. And it doesn’t stop there, but breaks above 500 and hits 650 with similar speed. Such moves make winning trades if we are riding them, or are even great lessons (for the future) in case we missed out on them. Incredible chart pattern and corresponding moves, isn’t it?
Inside Bars
An Inside Bar is a sign of falling volatility. The current bar’s range is within the previous bar’s range. Another way of saying the same thing – an inside bar has a low greater than the previous bar’s low and a high less than the previous bar’s high.
Go with the Trend
Inside bars are a sign of indecision with the current trend … we assume that the indecision will be resolved in favor of continuing the current trend. Therefore, if the current trend is up, traders should use the Inside Bar as a setup to buy. If the trend is down, use the inside bar setup for a sell. If no trend is visible, then the inside bar has no technical significance, and, should be ignored.
How to Trade:
For entry and initial stop placement: buy as the stock trades above the Inside bar, sell as the stock trades below the Inside bar. A stop loss is placed on the opposite side.
Inside bars are successful most of time and easy to trade with confirmed breakout on either side. But always use your own setup and rules with it while trading.