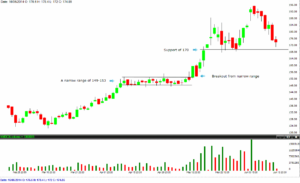
I added a chart of NMDC last month, and discussed various patterns formed within it. The last pattern which was still under construction at that time was a movement in a very narrow range of 149-153.
Prices broke out from that narrow range on next day, and started a stronger rally. The stock touched a high of 196, an almost 30% gain in just one month. Now the stock is going through correction and a probable support of 170 should sustain. However a trader should stay away, until it bounce back from support or either breakdown through it.
The narrow range patterns are very useful and fruitful most of time. Whenever a stock or index is trading within a close narrow range, then it means buyers and sellers are in a confusion and equally matched in the market, that is why price is not going in any direction. But breakout or breakdown from these ranges leads to big moves; it is like a silence before a big storm.
Traders should trade these kind of high probability and low risk patterns, and wait patiently until they arrive in some stock or index. There are many times when we should not trade and only wait for arrival of a pattern or a range breakout.


How 2 find out the Target on long side ?
And how 2 identify false brake out ?