Login
Login Sign Up
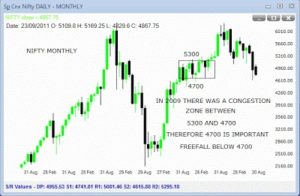
View from the monthly chart for the Nifty shows a congestion zone developed in 2009 between 4700 and 5300 approximately. This gives a message: the 4700 area has held for many months in 2009. If, and, of course, this is a big IF – the 4700 support cracks we could expect a free fall in the Index
Chart below: