 Login
Login Sign Up
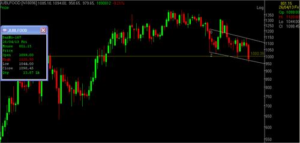
I was going through the technical charts of the stocks i track, as a part of my routine, and came across the weekly chart of Jubilant Foodworks:
Now there are some very interesting things to observe here:
1. It has been in a trading range since around last 18 weeks, and is all set to break it on the downside. It did break it, but not decisively.
2. For the 1st time since March ’12, which is after 15 months, JublFoods has closed below 1000.
3. On daily charts, it gave two consecutive closings below 1000, which says a lot in relation to the psychological levels of its prices as well.
Its important to keep in mind that this direction seems to be coming on weekly charts. So while we see what the markets do, we can at least keep this chart in our mind. What say?