 Login
Login Sign Up
Rushabh Shastri said…
its out of this subject But somehow IT index dont look encouraging at current time, bulls need some more confirmation it looks targeting below 6000 cnx it.
My Notes:
The CNX-IT Index had a strong up move. There are signs that this up move may be coming to an end. I am giving the chart for CNX-IT with my notes on the chart. The Notes are explained in detail, here.
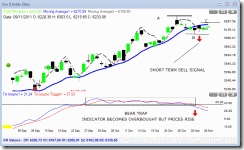
- A pattern of lower highs is possible given weakness in the markets. The fIrst high was at A. After a correction at B, prices have moved up to C, which remains below A. If prices remain below the high of C, then we will see a pattern of lower highs. Once price goes below B, the lower lows pattern will also kick in. Remember, this has not happened yet.
- A short term sell signal came in when the short term moving average (dotted line) moved below the intermediate average. That signal continues, so short term traders should look to sell on rallies.
- the TA-Insync, an advanced momentum indicator has broken down from a 6 week support area suggesting weakness.
Traders Summary: The short term trend is down. The intermediate trend remains up but has the possibility of breaking down. Aggressive traders should follow the short term trend managing their volumes and risk. Conservative traders can wait for the charts and the indicators to give the same signal – both should be bearish or bullish.