 Login
Login Sign Up
On Friday, in the USA, a jobs report caused a sharp drop in the S&P from 1125 to 1110. Then, intraday, a rally started which took the SP back to 1121. Afraidtotrade.com has a 5 minute chart of the SP highlighted the technical signals which indicated the en of the down move & start of an intraday up move. Here is the edited chart:
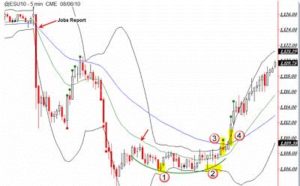
Here are comments from afraidtotrade.com
- Failed Impulse Sell
Generally, after a market makes a new price, momentum, and TICK (market internals) low, we would expect lower prices yet to come. A good trade set-up – that I call the “Impulse Sell” – occurs when price rallies into resistance after a sharp downward thrust. We expect lower prices ahead.
2. Rounded Reversal Formation
3. “Kick-off” Sign of Strength
4. Bollinger Band and 50 period EMA Breakout
I’m not sure this gave you much of a ‘warning’ but it was the final signal needed – the final nail in the bearish coffin for the day – that odds strongly favored a reversal. This was your execution signal to get long – or take your stop-losses if you remained in an intraday short-sale position.
from: http://blog.afraidtotrade.com/lesson-the-four-early-warning-signals-given-before-the-afternoon-reversal/