Vinod asks:
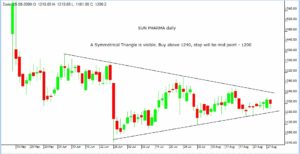
“Is the pattern in Sun Pharma a Symmetrical Triangle? If yes how will you trade it now. It looks like a breakout is on the cards. what is the target.”
Yes, the pattern does suggest a contracting triangle, ready to break out. I am giving the chart below. Trading tactics can vary: 1. buy now in anticipation. Keep a stop below the lower line. 2. Wait for breakout. Buy at breakout point – around 1240. 3. Buy after breakout, on a pullback. How you trade depends on your aptitude.

Trading Range in Nifty
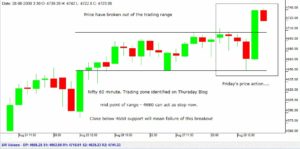
On Thursday, in my post, I had identified a range in the Nifty, suggesting that a move out of the range will be tradeable. Shazia asks: “How to determine the boundaries within the contraction?
The first breakout apparently looks on the upside.. 4730 was the upper boundary which was broken on Friday.” I was tracking the range on 60 minute charts, which give finer support/resistance levels. The chart is given below. Notes on the chart are hopefully self explanatory.

Pi says, “Can you write a post on the post 4700 breakout. Technically we did see a 2009 high, but it didn’t really seem like a strong breakout to me. Maybe we might have it on Monday – or maybe not. Can you suggest, when we can say with confidence that we have a breakout (though with so many people anticipating i doubt it will happen). Or it might turn out to be a false breakout. How/when does one decide that the breakout was a false one and to distinguish any pullback from a deeper correction of the Mar-Aug bull run ?”
My Notes: A breakout is a breakout. The only way to challenge it is to wait for it to fail. Minor support comes at 4600, so a close below this level is required to suggest that the breakout may not be working. For short term traders, the levels may be different. Please see chart above.

