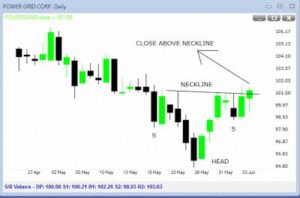
The chart for Power grid shows a bullish pattern. We can see a bullish (inverted) head and shoulder pattern. The pattern was confirmed today when prices closed above the neckline, giving a target of 107 approx. The chart is given below. Trades must be taken in context – if the market is moving up the target has a strong chance of being met. If the market is sideways or down, prices may go sideways and not touch the target. Yet, there is a message in such patterns – the trend for this stock is up.


