 Login
Login Sign Up
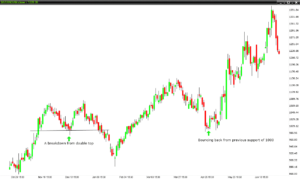
BATA INDIA breakdown from the double top on 15 January with a target of 920 and meet target on 30 January. On the next day, it bounced back from its target level and resumes its uptrend and touched the high of 1150 on 1 April. After a strong uptrend, a correction must visit stock and stock corrected almost 50% of its gains and touched the level of 1000 again, also neckline of double top on 6 May.
The stock is in a continuous uptrend after that correction, and after every consecutive rally it gave a dip and then again bounce back from it, thus providing opportunity to re-enter and making trend stronger.
In the last few months stock goes through many phases, it confirms a pattern and successfully meet the target. Then it took a strong rally, passes through a correction and again bounce back from support. Even now after every sharp rally it gave a dip(a buying opportunity).
Thus, these kind of stocks clearly indicates that the patterns work in the market and after a strong rally a correction makes the trend more stronger(rather than thinking the start of bearish move), and the only tool a trader needs to trade these kind of charts is patience and discipline.