 Login
Login Sign Up
The Nifty topped out in June, and since then it has essentially been sideways. True, we saw a sharp decline, then a V shaped rally. But, at the end of it all, we are almost where we were in mid June, suggesting that the market trend is really choppy / sideways.
Indicators can help us in identifying the trend. Sometimes, the indicator will go wrong, and, you can end up on the wrong side. That’s where your judgement comes in. But, often, an indicator will provide a sense of direction, answering the question: is it a trending market or a range bound market?
Three indicators normally used for this purpose are: ADX, VHF (vertical horizontal filter) and R-Squared. There are many more, and it is easy to create your own trend-no trend indicator if you have the appropriate software. Let us look at the Nifty with R Squared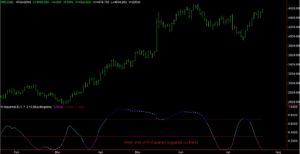 :
:
Examine the chart carefully. What happened after the indicator touched the lower levels of the ‘no trend’ area? Can you detect a cycle of contraction – expansion – contraction ? Currently, the indicator is at the lowest extreme suggesting that the process of contraction is now going to change into expansion.