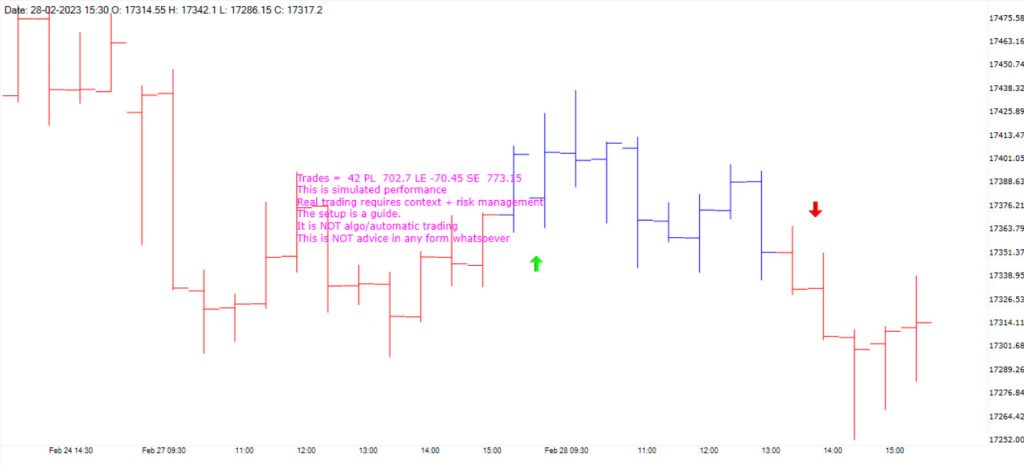
1. PURPOSE
This is a setup rather than a query that helps you to identify trends on the chart up or down.
This is simulated performance. Real trading requires context + risk management. The setup is a guide. It is NOT algo/automatic trading. This is NOT advice in any form whatsoever.
2. INPUTS
The setup has a set of inputs. Let us discuss them one by one. For this purpose, first, you need to open a chart and then insert this query from the MENU ‘SCRIPT’. We suggest using High Low Price Chart.
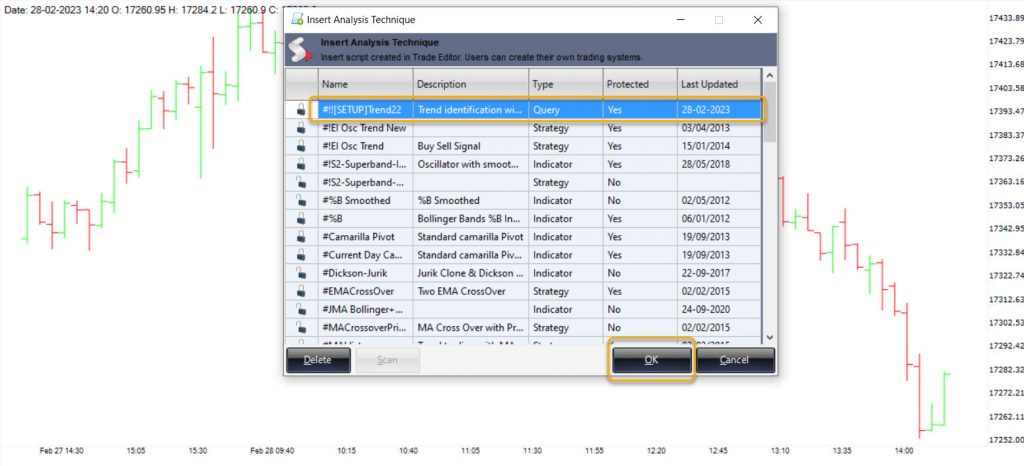
Once you click on OK, you will see the following input.

Explanation of the inputs:
Input length required for 2 different calculation
1. Level1 = Fast Momentum
2. Level2 = Normal Momentum
3. Level2A defines the strength of Level 2. Level2A should be between 1 to 4
Input colors for paint bars
4. show colors 1 = 1. Colors will be painted on price bars. Any other value no colors will be painted.
5. UP Color = color of uptrend bars. Default is Blue
6. Down color = color of downtrend bars. Default is Red
If show color 1 is not 1, then UP color and Down color will have no effect since no colors will be painted.
Recommended: always keep show colors 1 to 1. The purpose is the show trend using color bars.
For the simulation
7. Simulate1 = 1. Simulates actual trading. If it is NOT 1, then no simulation is done. Recommended. Always keep Simulate1 to 1. Simulatio displays the point at which simulated trades would have been taken.
8. Start time hh:mm = the time from which intraday trading will start. The default is 09:30. Please note that format is HH:MM.
9. Last time hh:mm = the time till intraday trades may be taken. The default is 15:20. Please note that format is HH:MM.
(All trades are closed at the close of the next price bar which comes after the Last time.)
Mainly for display of simulated trades
10. Buy Marker = the display which will be shown on the chart where buy trade is simulated. Default is: “###”.
11. Sell Marker = the display which will be shown on the chart where sell trade is simulated. Default is: “###”.
12. Marker Buy level Color = color of the buy marker. default is “ForestGreen”
13. Marker Sell level Color = color of the buy marker. default is “Magenta”
14. show Report1 = if this is 1 then at the end of the chart a simulated performance will be displayed. Keep this as 0. When you want to see the performance then change to 1. If you keep this as 1 then report will be displayed after every price bar update which is usually not needed.
15. Intra1Carry2 = Choose 1 if you are doing intraday trades. Choose 2 if you are taking carry forward trades.
16. Start date = date from which simulation will be done. Default is today’s date. This will have to be changed to date from which you want to simulate
17. Last date = date till which simulation will be done. Default is today’s date. This need not be changed since if date does not exist it will be ignored.
3. HOW TO INTERPRET
Suggested format: High Low price bars.
The price bars are painted according to the trend. In the case of candlesticks, the candle is painted, for example, red, and then does not show if the candle had open > close or vice versa.
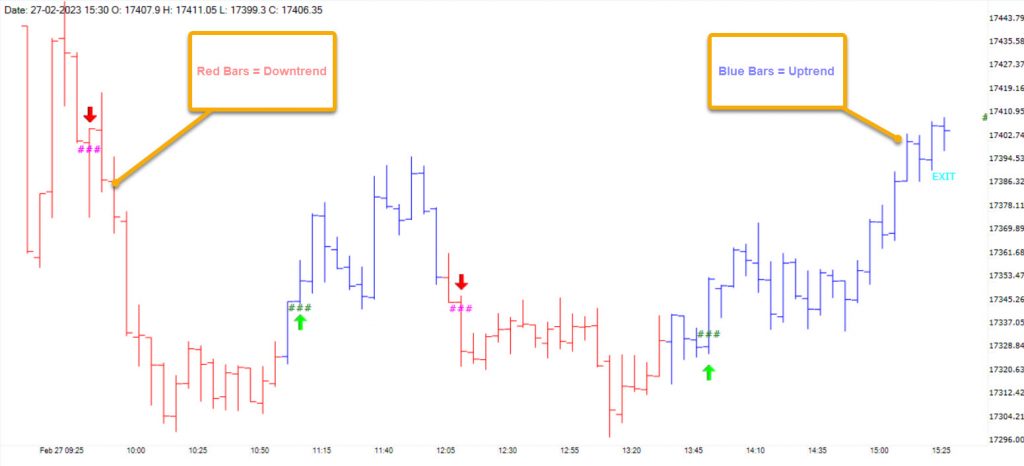
For intra-day trades, a simulation can be done which calculated the simulated performance of the trend.
The simulation follows the rules given below: trades are taken from the start time to the last time which is both user inputs. Default is 09:30 and 15:20.
Long trades are assumed when there is an up bar. The simulated trade is taken when the high of the up bar is crossed above in the next bar.
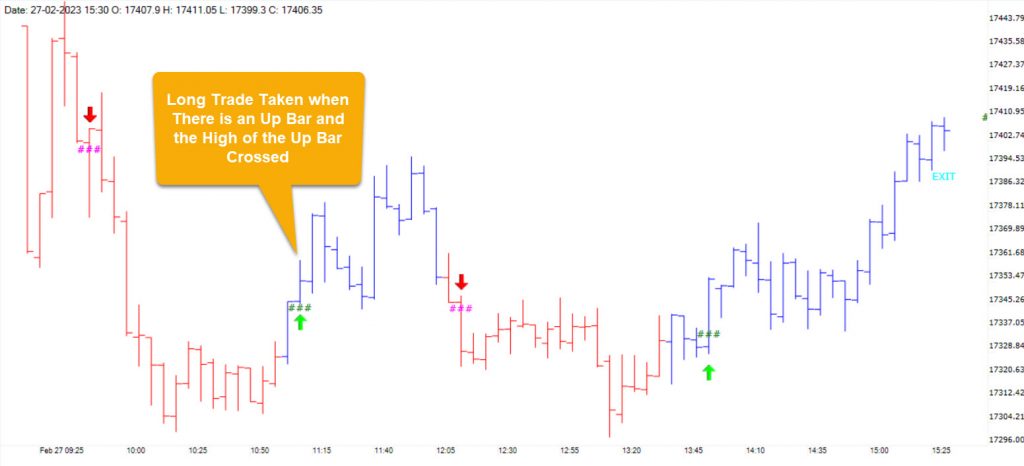
Short trades are assumed when there is a down bar. The simulated trade is taken when the low of the previous 2 bars is crossed below in the next bar.
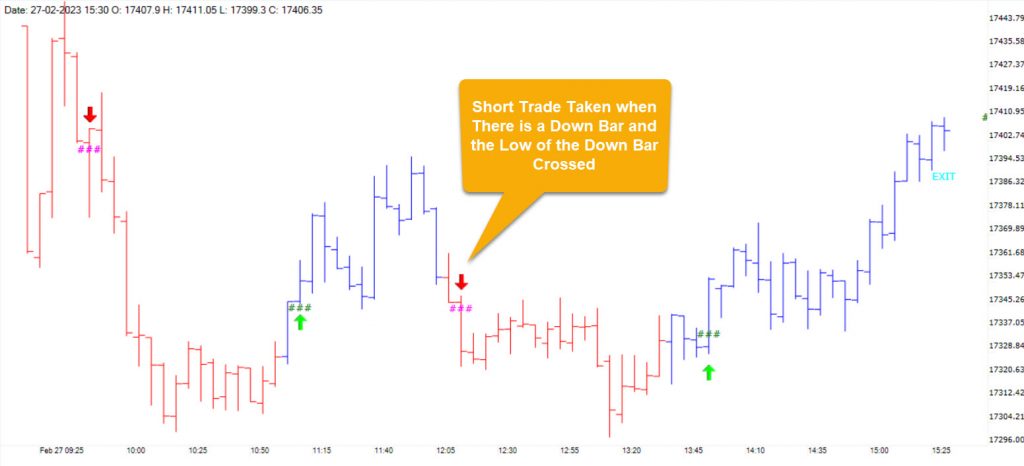
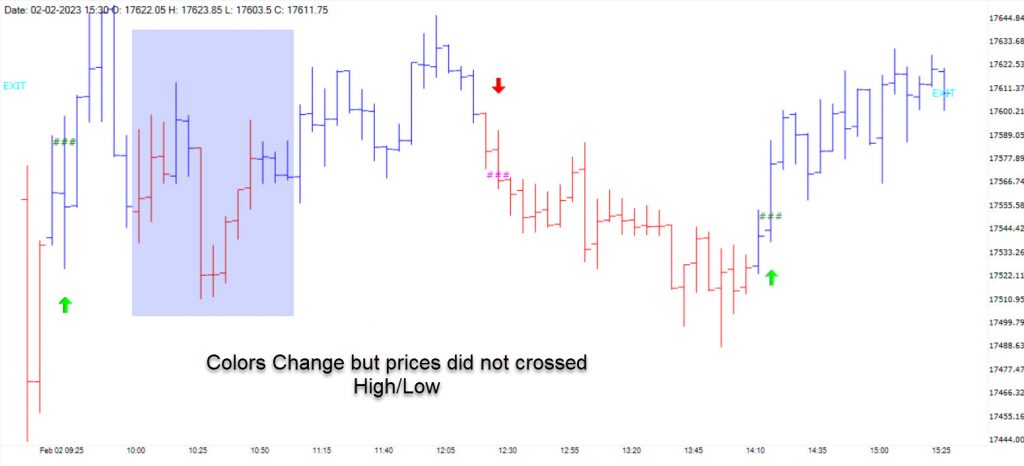
It is possible that the simulated trade is not taken even when the color changes because the next bar did not see a high/low crossing. This simple rule often prevents whipsaws.
If it is carry forward, then PL is calculated on the last bar also for carry, trades are taken at close of bar in which color changes.
