Login
Login Sign Up
Improved version of MACD - Available in Trend Analyser
How to download
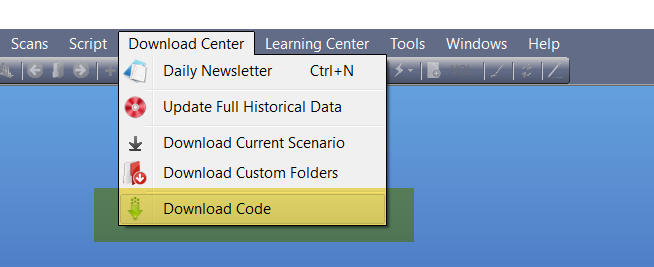
Open Trend Analyser and then click on the Menu – Download Center.
Please select option Download codes.
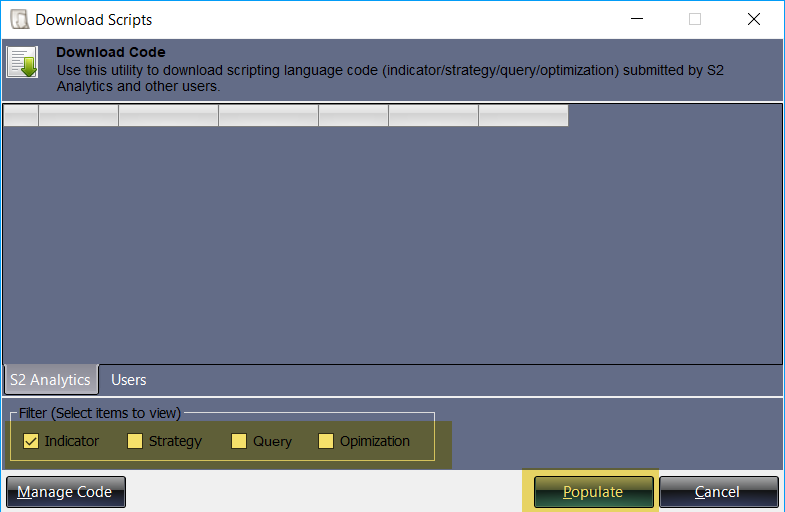
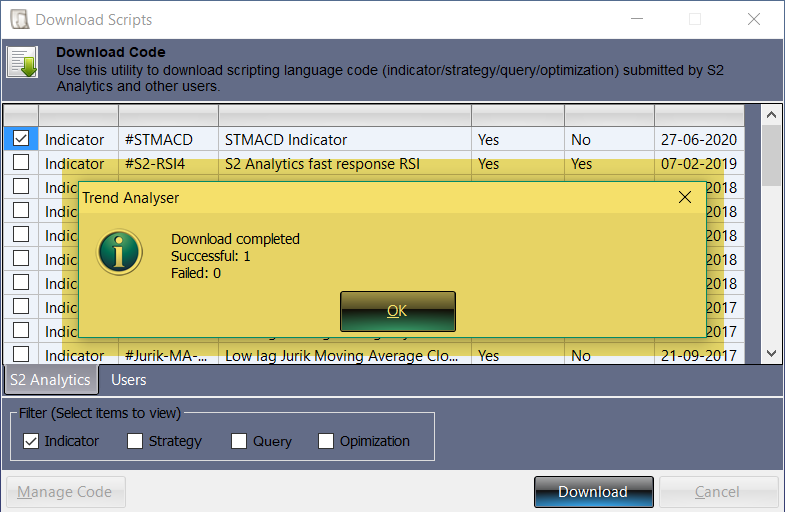
A window of Download Scripts will appear in front of you. On the lower panel in this window Mark the indicator box and then click on Populate Tab.
A new window will appear on your screen with the list of available indicators to download. Mark on #STMACD and then click on download.
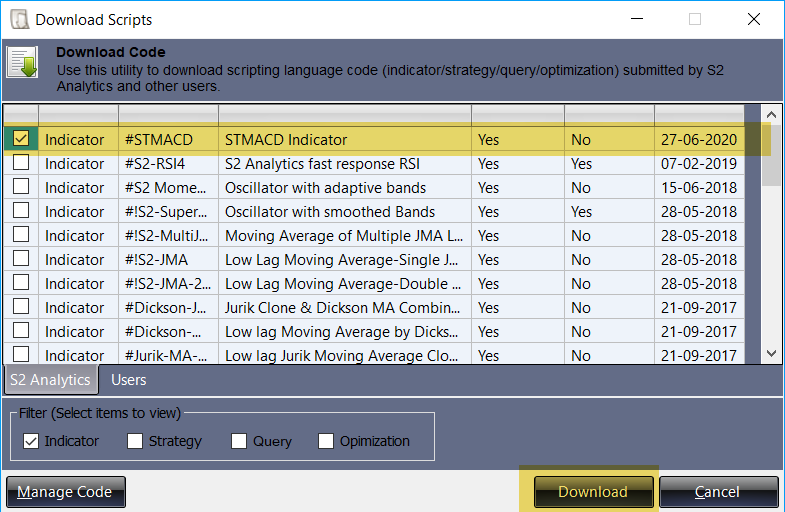
You will get a message of Download Complete. Click on OK to complete the process.
How to apply this indicator on chart?
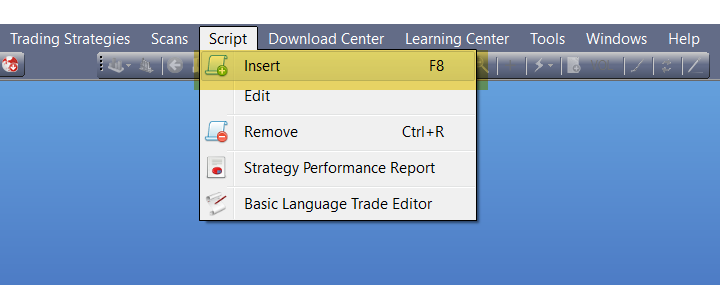
In order to apply this indicator you need to open a chart first and then click on the Menu – Script and then select option ‘Insert.’
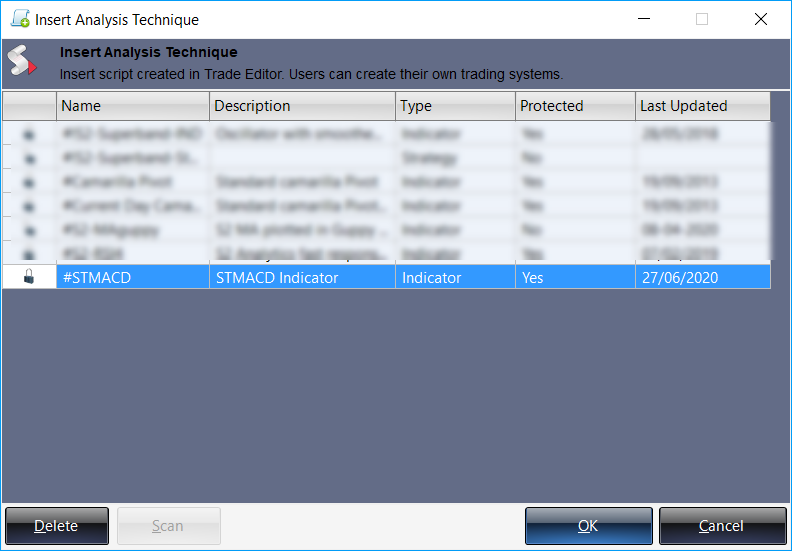
A new window will appear on your screen with the list of available scripts to apply. Select #STMACD and then click on OK.
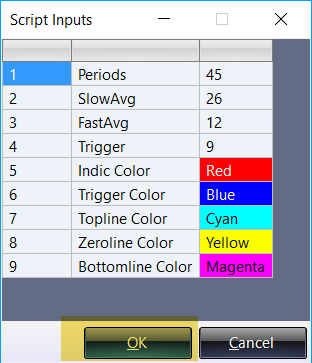
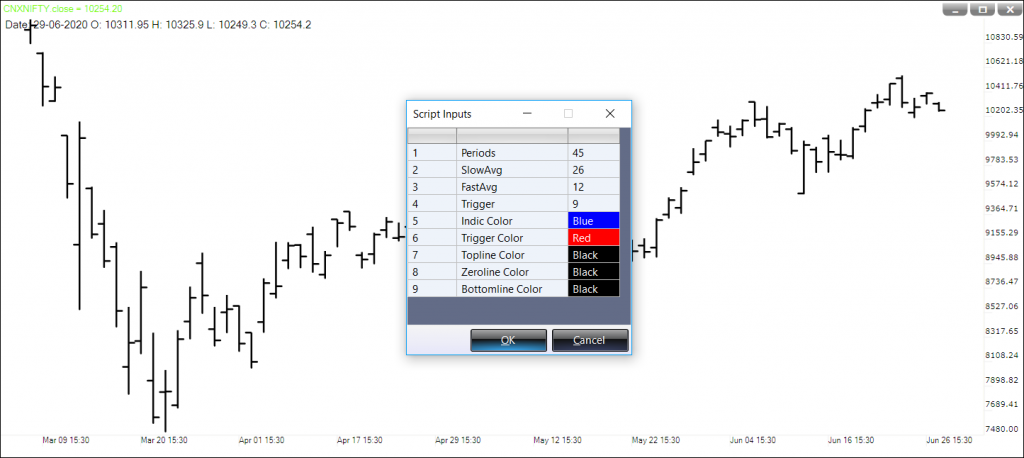
A window of Script Input will appear on your screen. You can use the default inputs or change it then click on OK.
How to use this Indicator?
PURPOSE
The MACD offers the best of both worlds: trend following and momentum but it cannot give an indication of price exhaustion. The Stochastic Oscillator identifies possible exhaustion of price but cannot identify the trend.
The STMACD is a combination of these two indicators. By doing this we can get information on trend change, trend direction with overbought / oversold levels by looking at a single indicator.
INPUTS
We recommend traders to use the default inputs only. This indicator uses following inputs:
Period: Default value is 45. We can fiddle this value on the basis of price swing. Lower value means fast movement of indicator and higher value means slow movement of indicator.
SlowAvg/FastAvg: These two inputs help to calculate the indicator line. Default value is 26 and 12 respectively.
Trigger: This input plots the trigger or signal line. This line is used for a crossover trade.
Indic/Trigger/Topline/Zeroline/Bottomline Color: These inputs help you to choose the color for the respective lines.
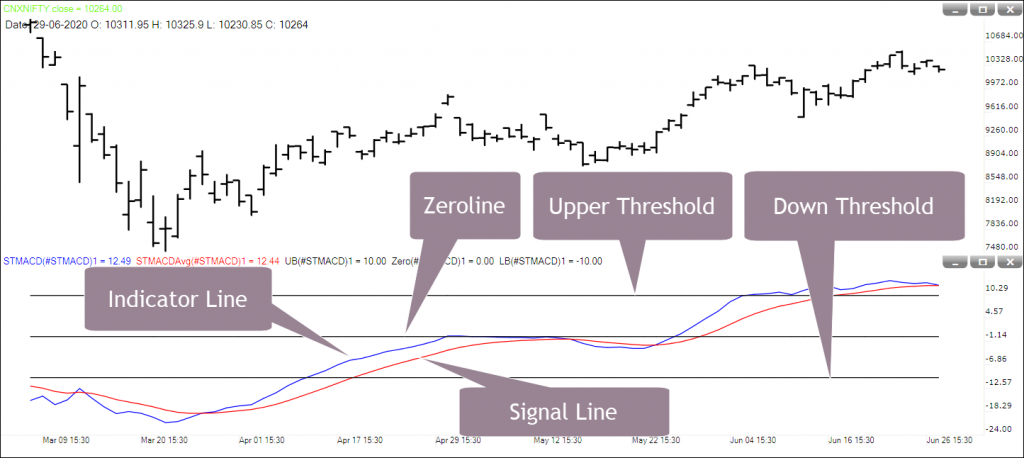
HOW TO INTERPRET
STMACD is an advance oscillator with a bound territory and also works as a trend indicator.
The indicator itself is able to differential between a trend and a strong trend. A crossover from signal line gives the first warning of a trend reversal and confirms it when indicator moves above the Zero Line.
A strong trend can be identified when indicator line moves above or below the threshold.
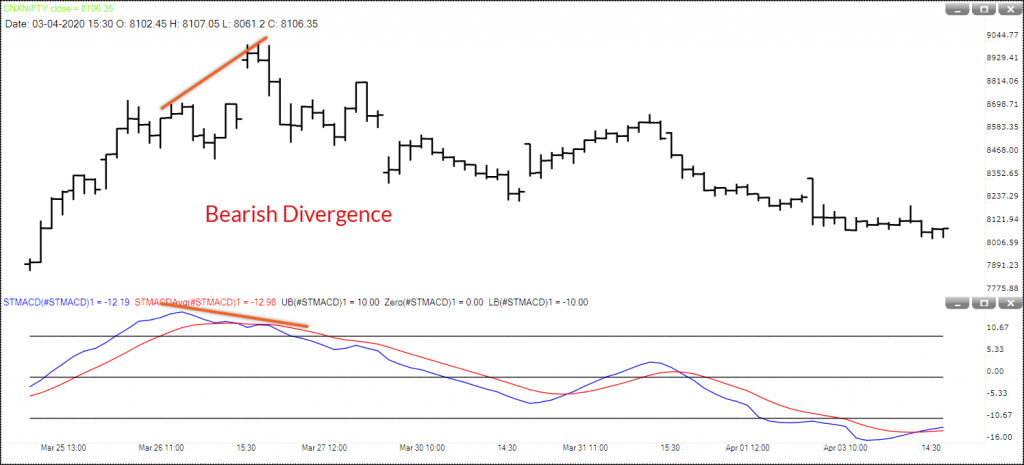
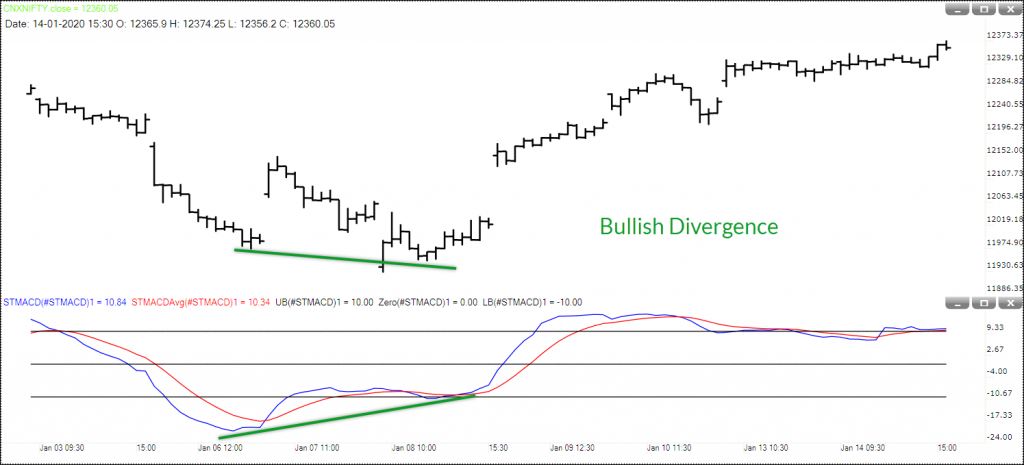
Like any other oscillator you can also find divergences here.
OUTPUT
The oscillator has few unique properties which we should look after. These are
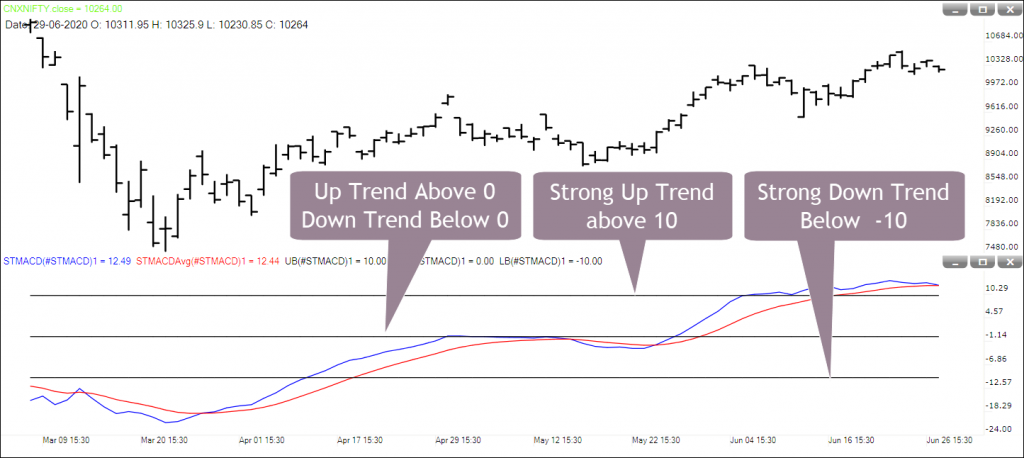
Trend: If indicator (Blue) line is above zero then it is an uptrend. If Indicator (Blue) line is below zero then it is a downtrend
Strong Uptrend: If indicator (Blue) line is above 10 then it is a strong uptrend.
Strong Downtrend: If indicator (Blue) line is below -10 then it is a strong downtrend.
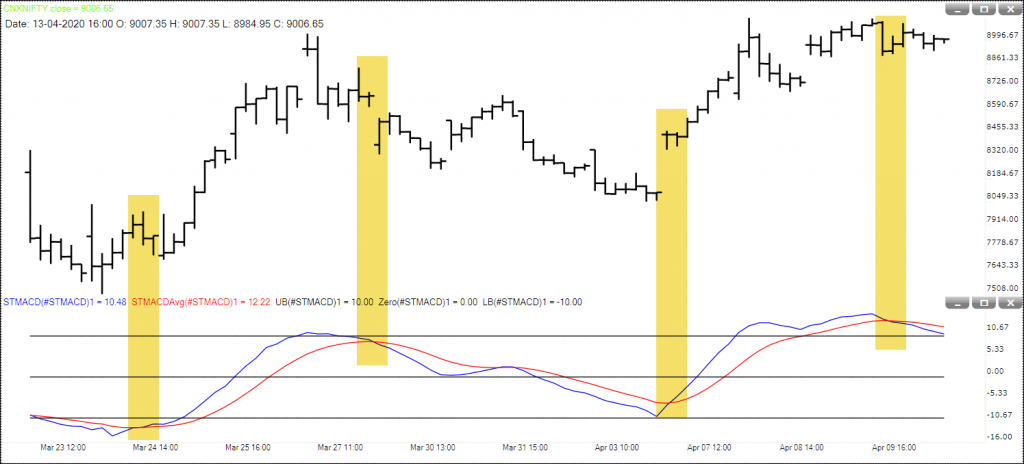
Trend Reversal: There are two ways to identify a trend reversal. These are
Crossover: When Blue Line crossed above the Red Line it suggests a Downtrend may be coming to an end.
When Blue Line crossed below the Red Line it suggests an Uptrend may be coming to an end.
Divergence: Divergence gives an early warning for trend reversal.
A lower low made by prices if not confirm by indicator then it is a sign of ending the down trend and beginning of a range or up trend.
A higher high made by prices if not confirm by indicator then it is a sign of ending the uptrend and beginning of a range or down trend.