Recently, at the Kolkata CNBC Investor Camp, a gentleman came to ask me about INOX. “I have been holding the stock since price was in the forties, please give your view on this.”
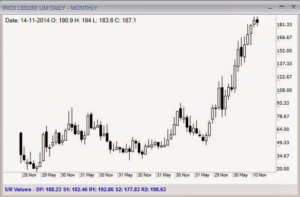
I am giving below, the monthly chart for INOX.

Investing and Trading is not just about entry and exit methods. It is much more about managing your positions. This should seem reasonable, because every business requires management. So, if trading is a business, it should also require management skills.
The Investor already has a position in the INOX stock, picked up (I think) when prices were building a base.
Once there was a base breakout, stock prices saw a parabolic rally, to eventually close at 187, this week.
This is how I view the chart:
October 2014 prices were in a narrow range, with upper and lower shadows. This could be a sign for a pause, or consolidation, or even an eventual reversal. We do not know now.
If Investor wanted to add to existing position, then a trade above October high of 194 should be a trigger to add new positions. For fresh positions, the stop should be below the October low of 182.
If Investor is looking for a trailing stop, then the September low of 162 should be used. September saw a long lower shadow, which tells us there were buyers when prices dipped towards 162. Next time on a dip, prices should hold this level.
If Investor is looking for a target, then I really have no level to suggest. When prices have parabolic rallies, the final highs can go anywhere. For investors seeking to exit, keep a stop below the previous month low and keep on trailing the stop till it is finally hit.

