 Login
Login Sign Up
In his latest Blog Post, Peter Brandt discusses the probability of Gold embarking on another uptrend.
So, I thought I should check out what the chart for Indian Gold Futures are saying. Mr Brandt refers to a 13 week channel which would give a bullish signal if prices break out above the upper resistance line. Here is the chart:
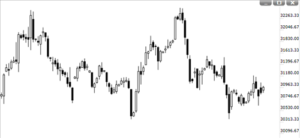
Well, a 13 week down sloping channel is not visible on Indian Futures thanks to currency fluctuations. This is the daily price chart for MCX Near Month Futures, from Sept 12 to January 9,13. What we have is a trading range. A confirmed buy signal comes when Gold goes above 32270. Traders can use a pivot around 31180 as the first sign of bullishness. A move above this pivot could be taken as a buy inside the larger trading zone.
How will you trade this chart? Please do give your feedback. Remember, you do not have to trade it at all.