Login
Login Sign Up
Mouli writes: On Friday (2nd December)when Nifty December Futures was around 5000 the stochastic and RSI was consistently above 85 and 75 respectively in 5 minute and 10 minutes chart and I went short at 5025, but it went till 5090. How to trade in such situations and avoid such mistake.
My Notes: It appears that you are new to technical analysis. Traders understand very well that overbought levels in momentum indicators are actually bullish when found in an uptrend. The trend is much more important than momentum levels. On Friday, the trend was up.
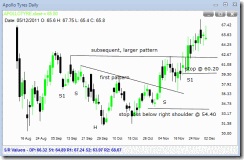
Anmol says: i have beenreading your blog for last three years .it helped quite good in improving my trading.i also watch your recomendation at cnbc tv 18.three days back you had given apollotyres as making HS PATERN but i am unable to find its stop loss.kidly clarify
My Notes: I am giving the chart for Apollo Tyres which will show the pattern, with stop loss. The initial stop is placed below the right shoulder. Then, once strong momentum is seen, the stop should be moved to the candle just preceding the breakout, which is shown for the second (subsequent) pattern. You should be aware of how the targets are calculated. Do a web search if you are not sure.
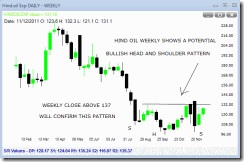
Technotrader says: Sir, have u have watched HOEC I think it is forming H&S at the bottom, huge increase in volume seen, indicators are also moving up and close above 135 with volume will confirm the pattern? Is is Ok sir?
My Notes:
Chart for HOEC given below, with my comments.