Login
Login Sign Up
Today’s small decline is viewed as a dip in an ongoing uptrend. My line of control for Bulls is at 5000 in Nifty. While the Nifty remains above 5000, I assume that any decline is a normal correction in what is now an ongoing up move. I obtained 5000 from the hourly chart for the Nifty where the low of 5000 was made before the bullish breakout above the neckline of the pattern. Chart below:
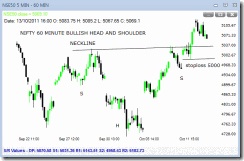
This pattern is coming inside an uptrend, which itself is part of a correction in an ongoing bear market. It remains anybody’s guess if the pattern will meet its target of 5350. Since, we have to trade on probabilities, I remain a buyer while the Nifty is above 5000.
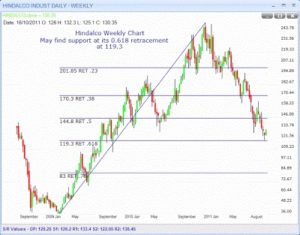
Hindalco trading at its support level. I have taken a retracement down in Hindalco from Low made at 36.75 on 08 March 2009 to High made at 252.85 on 09 Jan 2011. From there, the price retraced at 0.618 retracement at 119.30 (this is also the low of the hindalco). Now at this point we can buy this stock. The relative strength of this stock is not very high so we have to take a tight stop loss just below to 0.618 retracement line at 110.
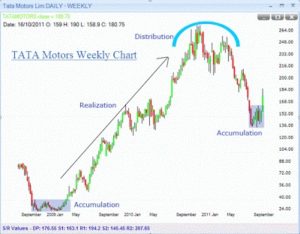
TATA Motors Life Cycle
A stocks cycle consists of three cycles – Accumulation, Realization and Distribution. TATA Motors has gone through its distribution stage. Its weekly charts suggest a process of accumulation. The next stge may be realization. A realization stage starts when a stock breaks up from the base. After breaking its base, the stock tries to move up very fast. Chart below: