Login
Login Sign Up
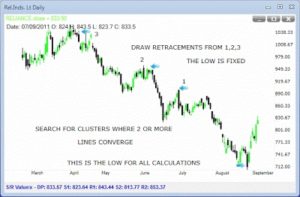
Sudhin asks “could you please explain how we are to fix the high and lows for calculating the fiboancci levels, for example in ril we have a low in place but how do we fix the high, as we have around 4-5 swing highs up to Jan 6th, if you could put up a chart it would be of great help. ”
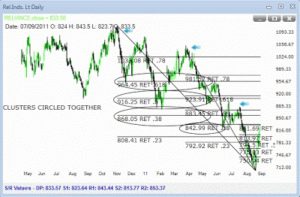
Please refer to the chart below. When drawing retracements to identify pullbacks in a downtrend, select the lowest low. I have marked this point. Now, move to the left of this low and select two or more swing high points. when two points are together, select only one of them. In this way, you draw retracements from a number of significant highs to one fixed low.By this time your chart is full of lines. That is fine. You are looking for clusters – areas where two or more levels come close. It is these clusters that should provide targets / resistance. Two charts – first, example of selecting the swing points, then the retracement levels (full of lines). retracement chart shows possible levels from December 10.
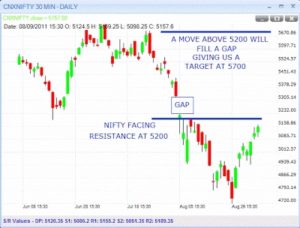
Nifty in a trading range
The Index could remain in this range for some days. if it does breakout, then there are interesting possibilities on the upside. Chart below.