Login
Login Sign Up
Open a chart, then apply four different indicators. Now, you have five charts on the screen (price + 4 indicators). Add a few studies on the price chart, like Bollinger bands, fib retracements, averages…). What do you get? I will show you an example:
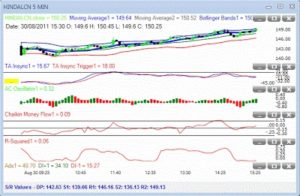
This is a spaghetti chart. You take a lot of indicators and throw it on the chart until it becomes unreadable. Worse, it is likely that the indicators are likely to contradict each other, giving a chart that will lead to ‘paralysis by analysis’. (Note: the indicators applied on the chart were selected at random).
Traders should have ‘clean’ charts to guide them in their trading. Whatever you have on the chart should be actionable. Some examples follow:
- On a high-low chart, develop rules to identify consolidation patterns. Your strategy should be to take a breakout from the consolidation,with proper stops and targets.
- Using a momentum indicator with a signal line, your strategy is to buy/sell minor pullbacks in the indicator in the direction of the signal line. (google information on ‘The Anti’ by Linda Bradford Raschke in the book ‘Street-smarts’)
- You trade the first pullback after prices cross the 20 period MA. These are simple rules, which should give a profitable trading strategy. I hope you get the idea. I request readers to provide their own ideas on similar strategies. While their views will be available in the comments section, I can make a complete post for these ideas if we get a reasonable number.
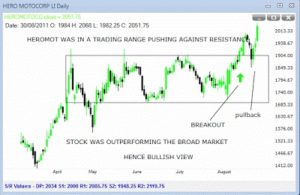
Why is Heromoto bullish
There was a question on heromoto (I could not locate that exact comment) in which I was asked why it was bullish for me. Here is the chart explaining the reason why I am upbeat.