 Login
Login Sign Up
My Charts Setup
I am sharing the setup which I use on my charts. I mainly use 5 minute, 60 minute charts for day/swing trading and daily, weekly,monthly charts for an intermediate/long term view. All my charts have the same setup – Candles and three technical tools. I am giving the Nifty EOD chart with the three tools which I will explain.
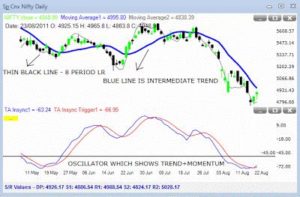
The Green and Black bars are candlesticks, which all users will recognize. If you do not know what candlesticks are, you should go a google search, now.
The deep blue line represents a 34 period zero lag moving average. The slope of this average gives me the intermediate trend. If the line is moving up, intermediate trend is up. If the line is moving down, the intermediate trend is down.
The light black line is a linear regression line with 8 periods as look back. I look at ‘hooks’ in the LR 8 line – change of direction in LR.
The Oscillator in the lower pane is called TA-Insync. This oscillator is a proprietary indicator in Trend Analyser. But, similar results can be simulated with a stochastic using a long look back. I have 55 as the look-back here, with 5 as the value for the trigger line – the red line. The trigger is simply a 5 period average of TA-Insync.
How do I use these tools? For analysis, mostly I look at the candlesticks and determine the trend, as well as identify any chart patterns that I can see. The tools are useful when I wish to take a trade. When trading, I need clear, well defined rules and indicators provide the rules. A crossover in the TA-Insync from oversold or overbought levels gives me a trading signal. So also does the ‘hook’ in the LR line. Once you want to go for disciplined trading, any number of rules can be created with any kind of indicators.
What happened to Volume?
In my chart setup, there is no volume. Sasi writes “about your strategy – I am quite surprised to see you not using volumes which I thought till date was the basic necessity’.
Well, yes, Sasi. Volume is certainly important. Now, here is a confession. I rarely look at volume. This simply means that I am comfortable with using price alone to identify trend, and, setups. I have done some work with raw volume and I could not find a correlation between price behavior and volume movment. I know that text books talk about the importance of volume and I respect these ideas. It is probably my failure to identify relationships.
But, a number of volume indicators are used in my strategies – Money Flow Index is a favorite. So, volume with price does help when used in strategies.
Sudhin says “but u have never answered most questions reaised here why?”
My Notes: When I find a question which is easy to answer, mainly because I understand that topic, I do reply quickly. However, I will try to respond to more questions.
Deepak Longani writes “Sudarshan ji me not been able to understand what is this “The deep blue line represents a 34 period zero lag moving average” can you please explain regards”
My Notes:
In the chart shown, there is a deep blue colored line. I am referring to this line. This is a moving average. The moving average is calculated with 34 periods as the lookback. Now, a number of new moving averages types have come up in recent years. This one is called a zero lag average. The commonly used ones are the simple moving average (SMA) and exponential average. Zero lag should be used independently – when it is rising the trend is up, when it is falling the trend is down.