Login
Login Sign Up
Barry Ritholtz (ritholtz.com) gives the opinion of Tomi Kilgore who says that the current bounce in the SP500 may be a suckers rally.
Tomi Kilgore warns that the recent bounce may be a sucker’s rally:
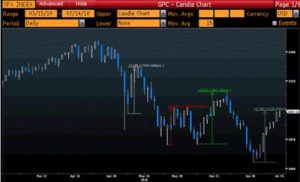
“The current rally marks the fourth time since early May that the Dow Jones Industrial Average has bounced more than 5%. Previous bounces have taken the Dow above key resistance levels, and yet subsequent declines have resulted in even lower lows. Essentially, the recent pattern surrounding key technical breakdowns and breakouts suggests the Dow is nearing yet another turning point.
It is easy for bulls to fall into another technical trap, since the Dow has climbed above the 50-day simple moving average, which has acted as resistance since the Dow first fell below it in early May, and is now peeking above a downward sloping line that started at the April 26 high and connects the June 21 high. But rather than embolden bulls, the apparent breakout should actually make them skeptical, especially following a six-session rally. “
Other traps of note:
-When the Dow fell below the 200-day moving average;
-After the Dow closed above the 50-day moving average
-When the Dow hit a new low for the year.
-The break below the June 8 low of 9757 (confirming a head-and-shoulders pattern)
Kilgore wanrs that “those reacting to technical breakdowns and breakouts have been fooled many times. And keep in mind that the Dow’s last six-session winning streak ended on April 26, the day before the market correction began.”
The broad trading range, lack of volume, and short term trends that reverse have some people sitting on their hands. Its not a bad way to prevent them from doing something silly
FREE Trial to Technical Analysis WEbsite
Two Week FREE Trial
For a limited time, Marketclub are offering a completely FREE 2 Week Trial to you. It requires no payment information and you can get started using MarketClub instantly!
FREE Access To All of Tools For The Trader…
Email Alerts—Know instantly when to make your moves.
Trade Triangle Technology—Market proven entry/exit signals.
Talking Chart Technology—The language of the market.
Smart Scan—Quickly find winning trends in any market.
Premium Charts—Get technical with superior charting tools.
Data Central—Unlimited downloads for over 320,000 symbols.
Portfolio Analysis—Know where your portfolio stands every day.
Trade School—Online seminars from the world’s top trading experts.
Diversified Research—Stocks, futures, metals, forex, ETFs and more.
Readers MUST take advantage of this free offer. Learning is the only way to become a better and better trader.
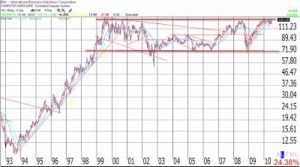
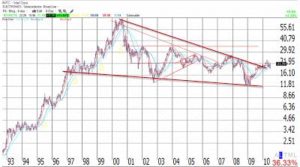
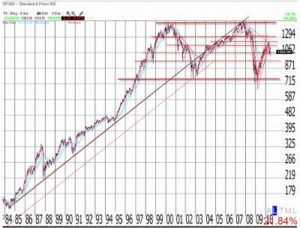
The look of a lost decade
We have discussed earlier that the U.S.markets have done nothing over the last 10 years. Here is what two of their leading stocks, IBM & INTEL look like over the past 20 years. Finally a chart for the S&P. We learn from history, so these charts are useful.
(charts from stockcharts.blogspot.com)