 Login
Login Sign Up
This from : http://www.greenfaucet.com/node/17239
Goldman Warns If 1,040 Is Taken Out In S&P, 865 Is Next Stop
Goldman’s trading desk technician John Noyce warns, the next stop in the head and shoulders formation, should 1040 be taken out, would be 865, not to mention a complete rout for global teleprompter stocks post the mid-term elections.
From Goldman:
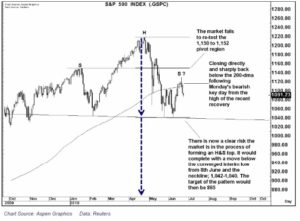
•The SP fails to sustain above the 200-dma with a clear risk of an H and S top forming…
•Early last week the market moved above the 200-dma which argued for some ST stabilisation and the chances of a deeper retrace of the drop from the April highs.
•The break however failed to yield any meaningful rally and the market has now moved back below the 200-dma on a close basis.
•As discussed over recent weeks the underlying structure of the market has a negative setup and you can now also argue an H and S top is in the process of forming.
•The interim low from 8th June and the neckline of that pattern are now converged; 1,042-1,040. This region
also represents the first notable support below current levels.
•If a break below the neckline of the pattern can be achieved as looks the risk on a multi-week basis the target would be 865.
•Overall, the market structurally looks a sell on rallies with the MT-LT (multi-week/-month) risks on the downside.
My Notes: The content as well as chart is from the source mentioned above. The note and chart were made before June 30. Yesterday, the neckline broke decisively, with the SP500 closing below it at 1030. Traders can learn from ongoing patterns, which is the purpose of putting up this post. More thoughts: When does the pattern fail? How does the trader use this information?