Multi timeframe Sine Wave indicator
How to download
Open Trend Analyser and then click on the Menu – Download Center.
Please select option Download codes.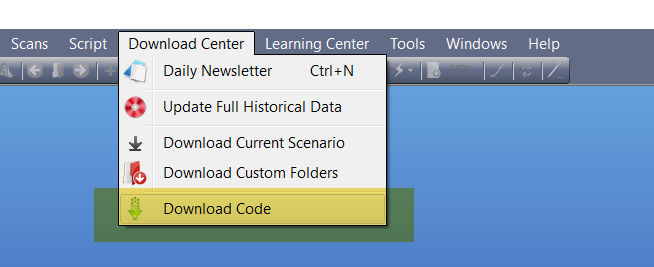
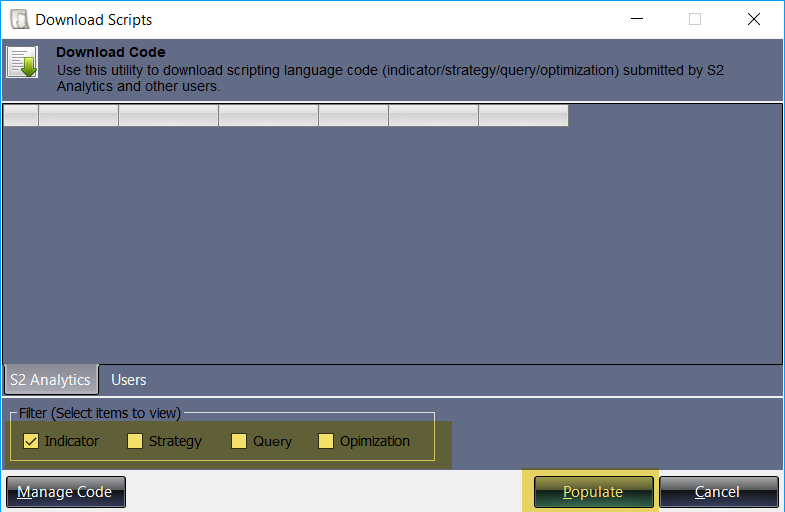
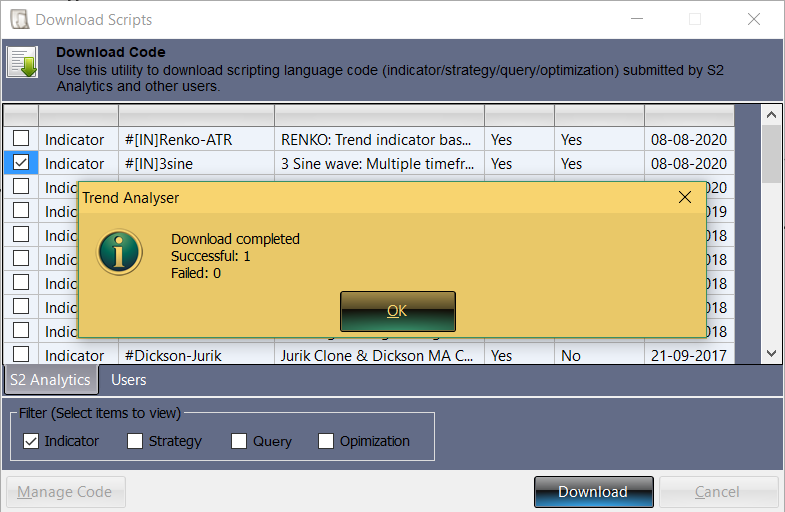
A window of Download Scripts will appear in front of you. On the lower panel in this window Mark the indicator box and then click on Populate Tab.
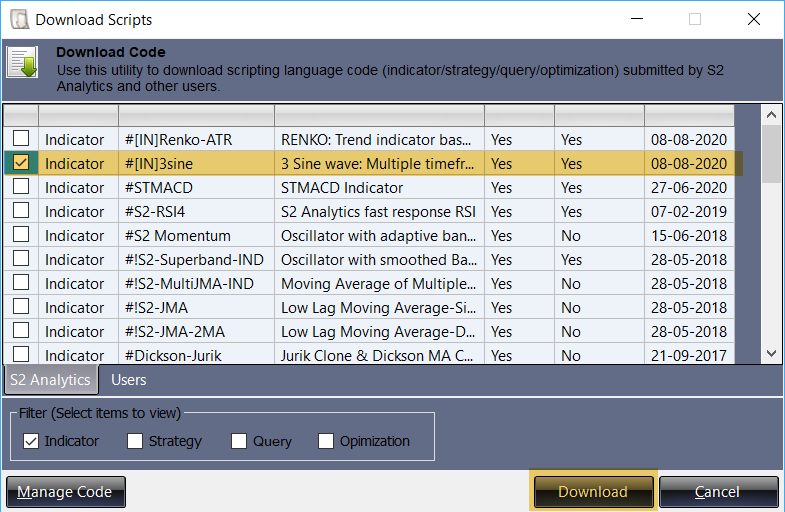
A new window will appear on your screen with the list of available indicators to download. Mark on #[IN]3sine and then click on download.
You will get a message of Download Complete. Click on OK to complete the process.
How to apply this indicator on chart?
In order to apply this indicator you need to open a chart first and then click on the Menu – Script and then select option ‘Insert.’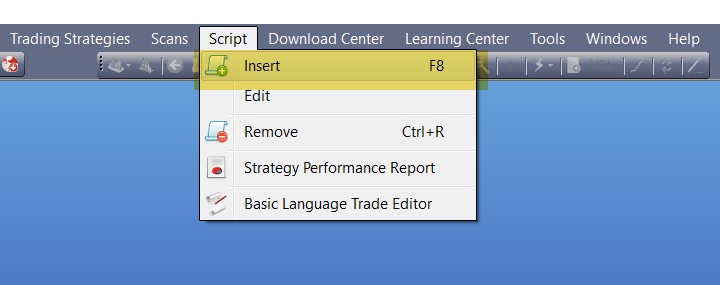
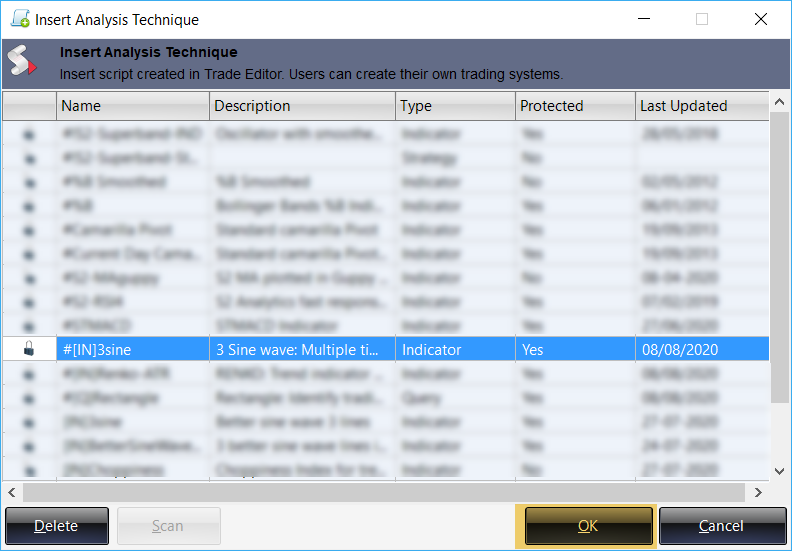
A new window will appear on your screen with the list of available scripts to apply. Select #[IN]3sine and then click on OK.
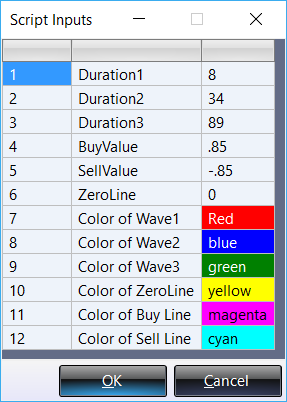
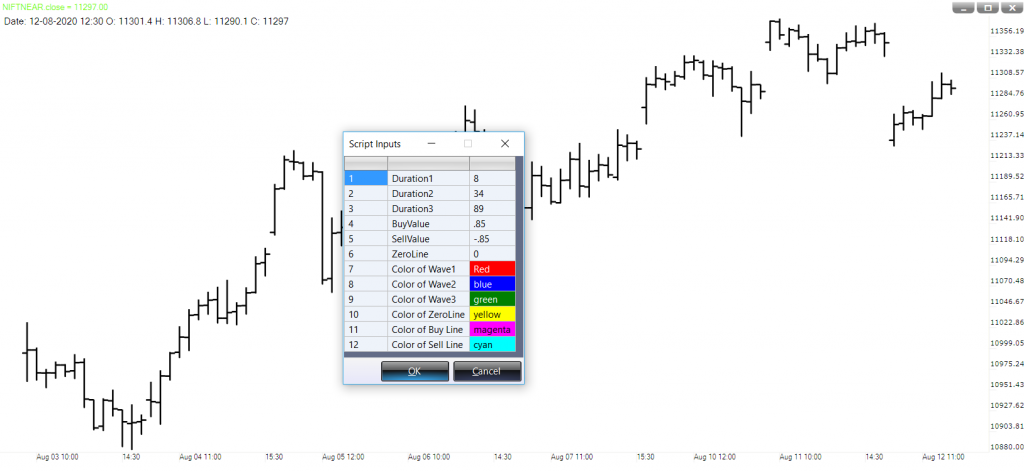
A window of Script Input will appear on your screen. You can use the default inputs or change it then click on OK.
How to use this Indicator?
PURPOSE
An indicator doesn’t need to be complicated to be effective. This indicator uses a single input to normalize the line in the wave to provide unambiguous long and short indications.
We have added two more lines in this indicator so that we can have an idea of the three trends of stock market (long, intermediate and shot term) by looking at a single chart.
INPUTS
We recommend traders to use the default inputs only. This indicator uses following inputs:
Duration1: Default input is ‘8’. This indicate short term trend.
Duration2: Default input is ‘34’. This indicate intermediate trend.
Duration3: Default input is ‘89’. This indicate long term trend.
BuyValue: Default input is ‘0.85’. This indicates overbought zone and also the strength of an uptrend.
SellValue: Default input is ‘-0.85’. This indicates oversold zone and also the strength of a downtrend.
ZeroLine: Default input is ‘0’.
Colors: Rest 6 inputs are for choosing the colors indicator and other parameters.
HOW TO INTERPRET
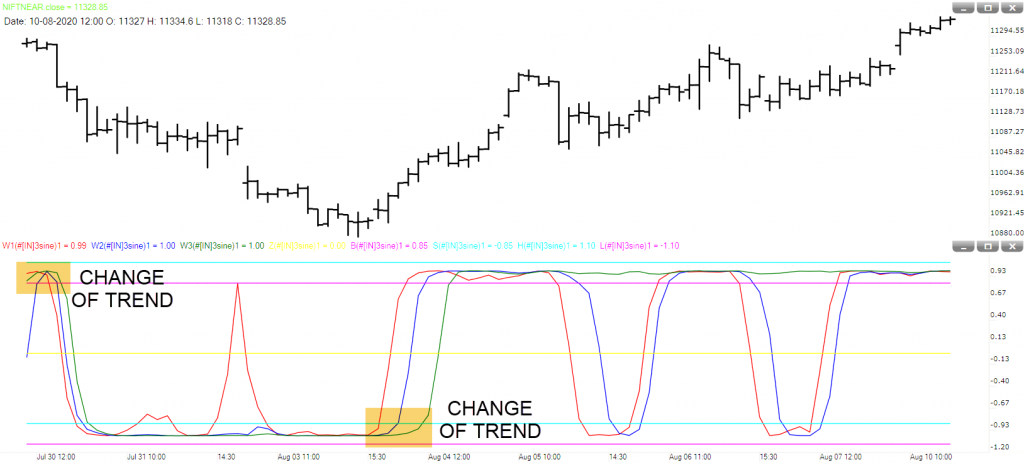
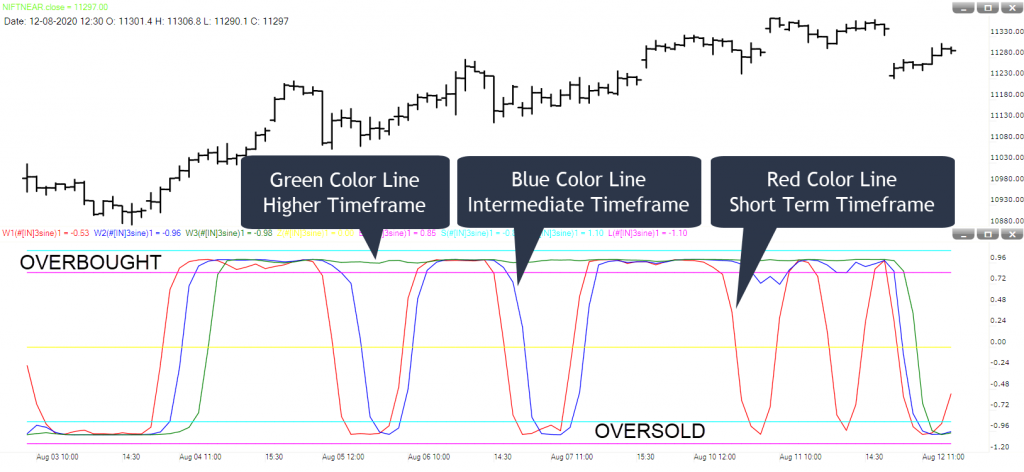
The indicator plots three lines. These lines represent the 3 trend of the market.
Short Term Trend (Red): This line represents the short term trend. With the help of this line we can know that in short term if prices are moving with or against the main trend.
Intermediate Trend (Blue): This line represents the intermediate trend. With the help of this line we can know that if prices are moving with or against the main trend.
Long Term Trend (Green): This line represents the long term trend. With the help of this line we can know that if prices are in a bullish or bearish territory.
A combination of above these three lines give more message which we will discuss in next section – ‘Output’.
Overbought/Up Trend Strength (Magenta): This is a zone for strong uptrend. If all three indicator lines are moving above this line then uptrend is very strong.
Oversold/Down Trend Strength (Cyan): This is a zone for strong downtrend. If all three indicator lines are moving below this line then downtrend is very strong.
OUTPUT
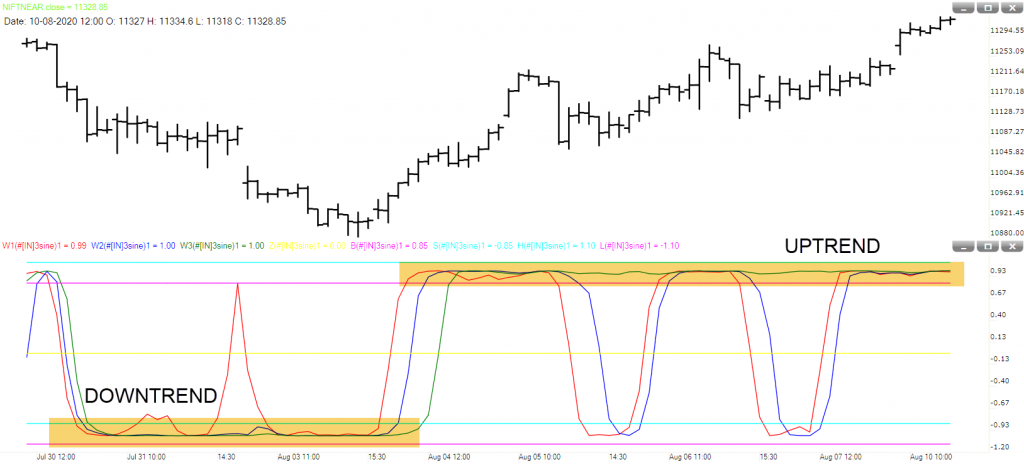
The indicator mainly gives us these four outputs.
Up Trend: If all the three lines are moving in overbought zone.
Down Trend: If all the three lines are moving in oversold zone.
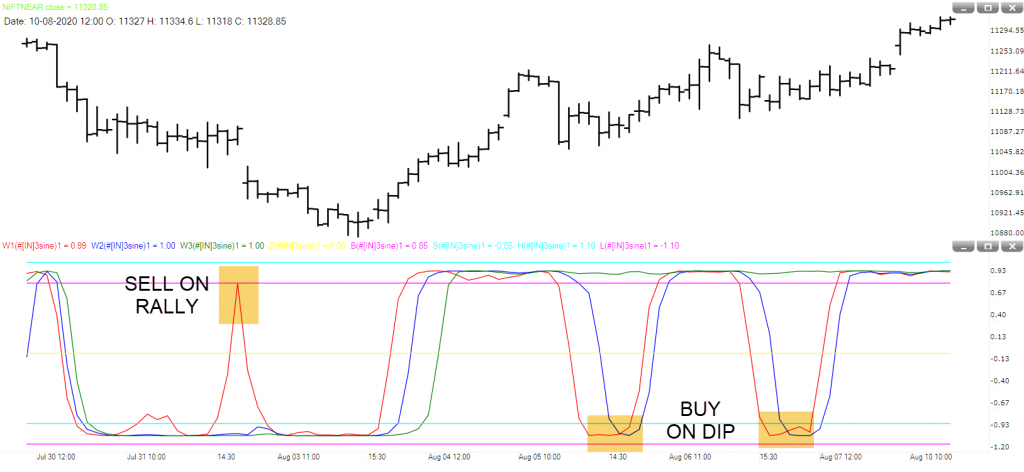
Buy on dip in an Up Trend: If Long Term Trend (Green Line) is moving in overbought zone and either one from Intermediate (Blue) and short term trend (Red) or both falls towards oversold zone.
Sell on rally in a Down Trend: If Long Term Trend (Green Line) is moving in oversold zone and either one from Intermediate (Blue) and short term trend (Red) or both rallies towards overbought zone.
Change of Trend (from Up to Down): If all the three lines are moving in overbought zone and breaks below the overbought (Magenta) line.
Change of Trend (from Down to Up): If all the three lines are moving in oversold zone and breaks above the oversold (Cyan) line.
