Trend Analyser EOD
EOD data for all Indian exchanges along with 30 min equities data.
-
12 Months ₹19,470 (Incl. GST)Order
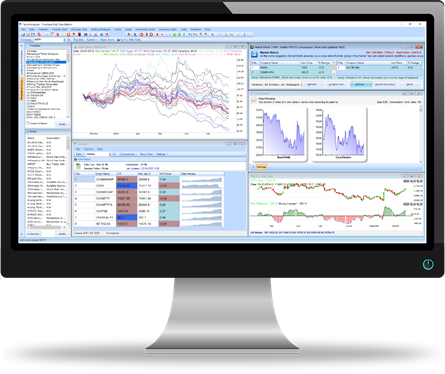
It is critical to have the right charting software to trade on stocks, futures, and other financial instruments. The right software can give you an edge in today’s competitive markets. Our product ‘Trend Analyser’ has been developed keeping all the key ingredients in mind such as trading tools, data management, ease of use and performance.
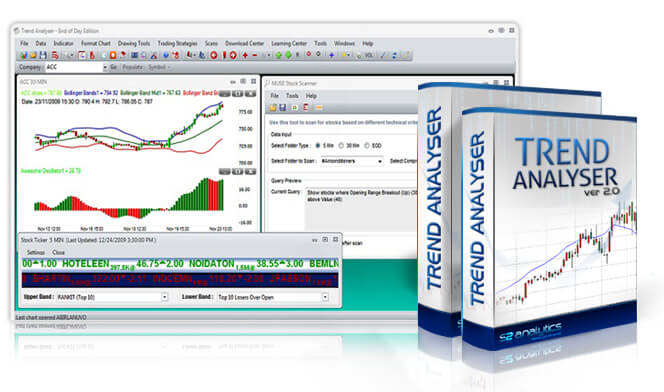
Trend Analyser is packed with all the tools you need to analyse the market. A lot of products boast of hundreds of indicators but that may not necessarily lead to better analysis. Trend Analyser has been designed and developed focused on the Indian stock market with standard and custom indicators developed by S2 Analytics. Moreover we give proprietary trading strategies which outperform standard techniques. Our easy to use product along with reliable data makes it one of the top charting software currently available.
Charting is powerful and easy with Trend Analyser (TA). You can view different types of chart such as Renko, Kagi, Three Line Break, Range Bar etc. Every chart window can be customized to suit your needs. Workspace and templates help you organize charts and indicators. Our other tools such as sector index, heat map, trade simulation etc. help in your analysis.
One of the most important functions of Trend Analyser is to help you identify a trend. The trend could be short term, medium term or long term depending on what you are looking for. We have several tools that help you achieve the same. Among them are trading strategies which are extremely useful, including our proprietary strategies such as Trend Energy, Escala, TA Turtle, C9 Reversal, Chaos Alligator, and TA Forecast.
Know more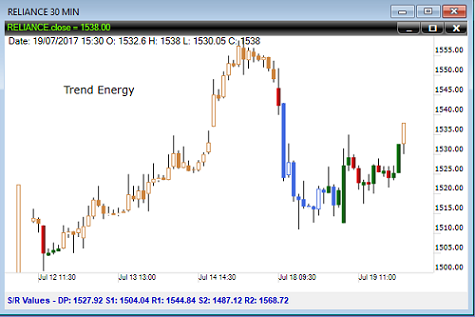
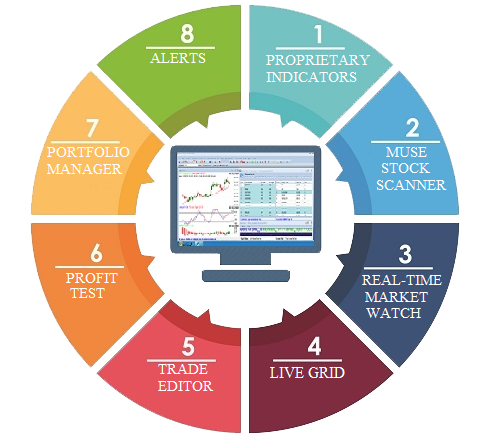
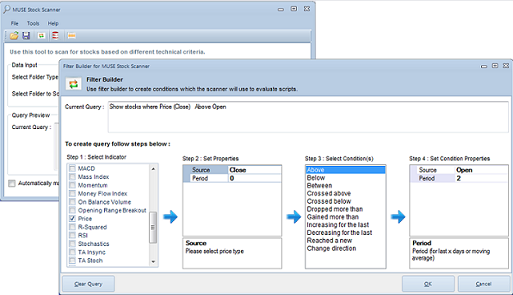
Trend Analyser market scanner allows you to find stocks like never before. It’s a powerful and multi-purpose scanner which gives you the ability to uncover profit-making opportunities. You can perform scans before, during and after market hours. Whether you are a novice or experienced trader, real time market scanner is an indispensable tool for trading stocks.
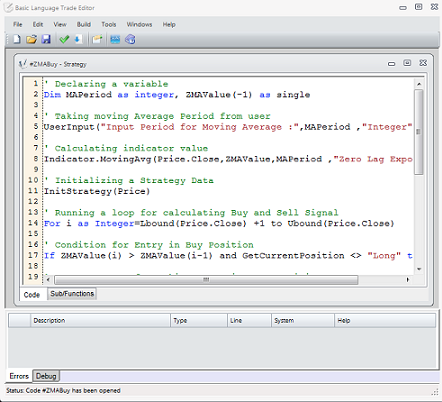
Basic Language Trade Editor is a computer programming platform for creating technical indicators, queries (scans), strategies and optimization. Basic Language Trade Editor uses the powerful VB.NET engine to run your code. The language is easy to learn and very powerful.
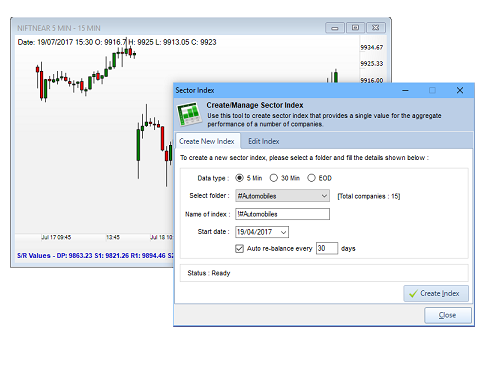
Sector Index summarizes the performance of stocks grouped by specific market sectors. This allows users to benchmark the performance of a particular stock market sector or industry. Though we provide data for several popular sectors like Bank, IT, FMCG etc., the program has inbuilt facility to create sector data for you. This powerful tool will enable you to create and rebalance your own sectors at the click of a button.
.png)
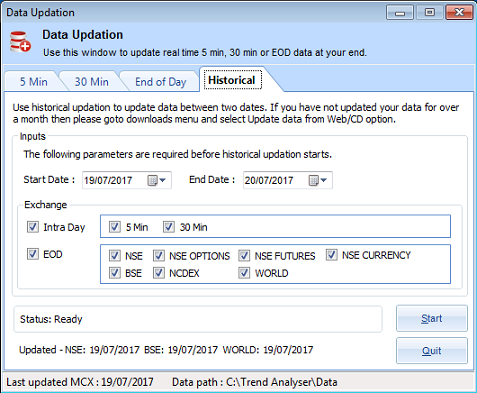
At S2 Analytics we have been giving market data for over 2 decades. In Trend Analyser you will get 5 min real time data for NSE futures, 30 min data for equities and EOD data for NSE Equities and F&O. The data quality and reliability is high. Updating real time and historical data is also very easy in Trend Analyser.
Learning how to use Trend Analyser is easy. Most of the menu names are intuitive and most options have one or two lines that describe their functionality. Online help is present which has details on every aspect of the program.
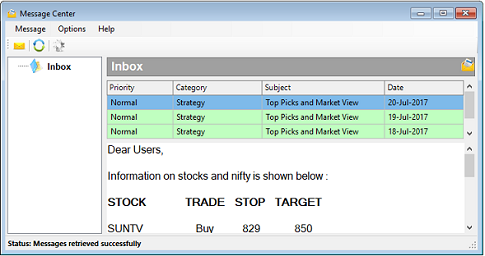
S2 Analytics is dedicated to providing high-quality products and excellent customer service. We provide comprehensive support for our products so that you can resolve your usage issues quickly. Get offers and stock tips through message center. Get intimation on new strategies and discount offers in the product itself. If you are facing any problem we will be happy to take your computer on remote support to solve it.
Trend Analyser has a demo version which you can download and use in order to evaluate the product. The demo version is valid for 7 days. Technical support and phone support is available to demo users. To download the demo, click the Free Download button at the top or bottom of this page.

Trend Analyser is a Windows desktop software. Currently it supports only Windows systems.

Watch video to learn how to activate demo with step-by-step guidance.
While there is no single correct way to trade the markets, in order to be successful, one needs to find the way that is right for him — a methodology that suits his personality. Only strategy is responsible for providing profits in market, so we should trade with the best one we have. Explore the list and find one which suits you better.

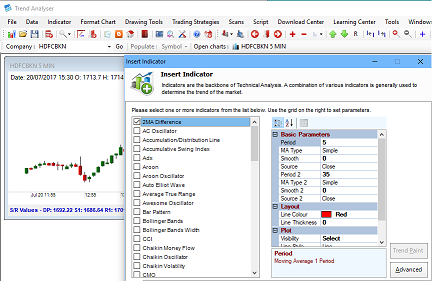
Indicators are commonly used by active traders, since they’re designed to analyze price movements. There are indicators which tell us whether we are in a trending phase or in a sideways phase. Similarly there are indicators which tell us the breakout or trend or support & resistance. Explore the list and find one which suits you better.
Trend Analyser is a premium charting software with proprietary indicators and strategies developed for the Indian stock market. Choose an edition and subscription plan below.
EOD data for all Indian exchanges along with 30 min equities data.
Real-time data for NSE stock futures, currency & MCX metals.
Subscription plans are billed per edition. For assistance choosing a plan, contact us or call 9289060691.